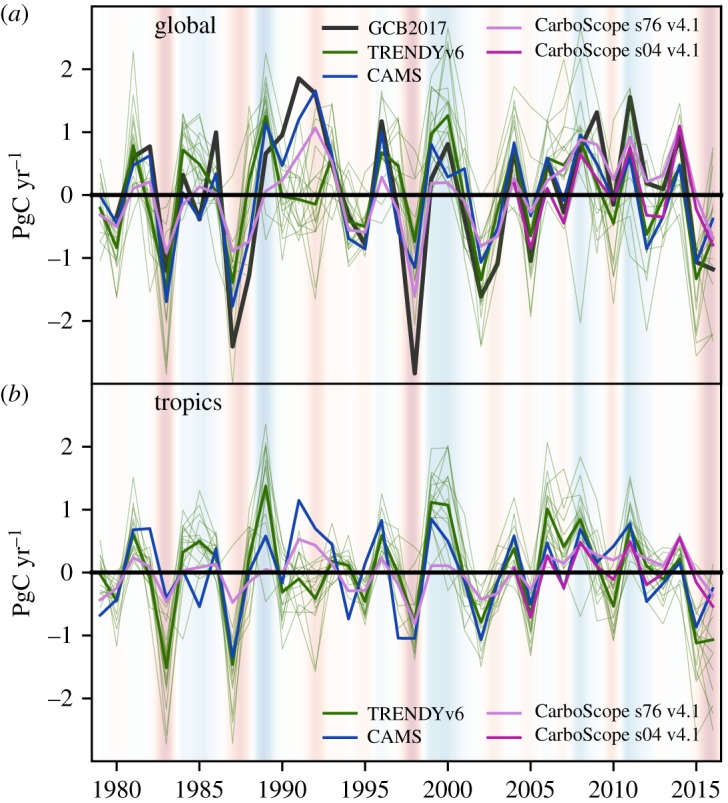
Figure 1.

Time-series of detrended annual NBPanom for the globe (a) and tropical regions (b), estimated as the residual sink by GCB2017 (black, globe only), CAMS v16r1 (blue), CarboScope76 (light magenta) and CarboScope04 (magenta) atmospheric inversions and TRENDYv6 models (green, thicker line indicates the multi-model ensemble mean (MMEM)). NBPanom is defined as the net atmosphere-to-land CO2 flux: positive anomalies indicate stronger-than-average CO2 sinks or lower-than-average CO2 sources. The shades in the background of both panels show the ENSO states (red – El Niño and blue – La Niña).
