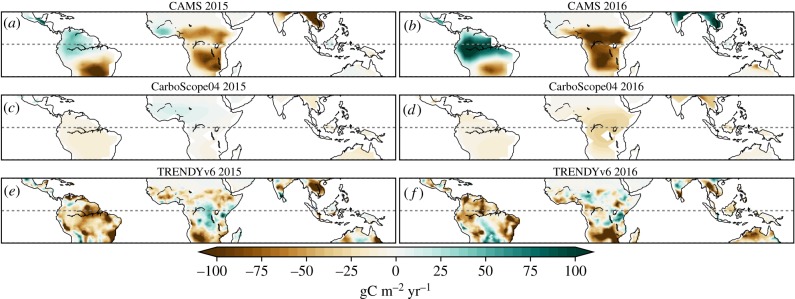
Figure 2.
NBPanom maps for the two recent El Niño years (2015/2016, (a,c,e)/(b,d,f)) estimated by CAMS (a,b) and CarboScope04 (c,d) inversions and the TRENDYv6 MMEM (e,f). Anomalies are calculated by deseasonalising and detrending the time-series for each pixel for 1979–2016 (2004–2016 for CarboScope04). Positive anomalies correspond to a stronger-than-average CO2 sink or a below-average source.

