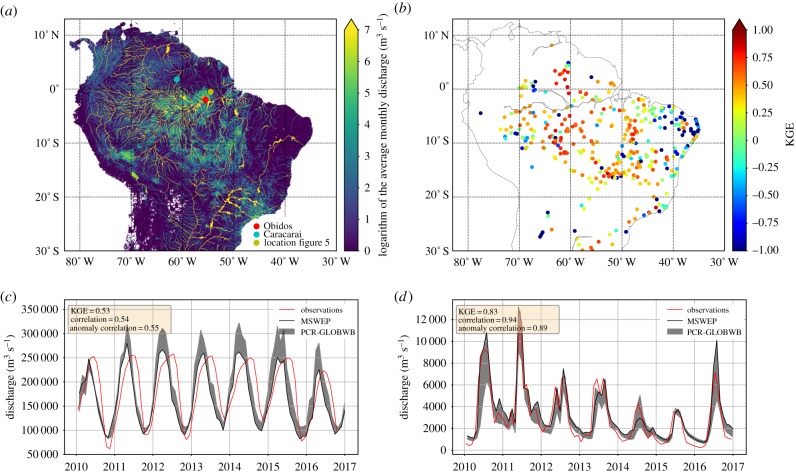
Figure 1.
(a) Mean monthly discharge over the Amazon basin as simulated with PCR-GLOBWB with MSWEP precipitation. (b) KGE (see Material and methods for explanation) model skill scores of the PCR-GLOBWB–MSWEP simulation for discharge stations across the Amazon basin (+1 indicates the highest skill score); observed and simulated discharge time series at (c) Obidos and (d) Caracarai. The locations of these stations are shown in (a). The grey bands in (c) and (d) indicate the minimum and maximum of the three different PCR-GLOBWB simulations with MSWEP, TRMM and ERA5 precipitation driver data, respectively. The black line indicates the simulation using MSWEP data.

