
Figure 4.
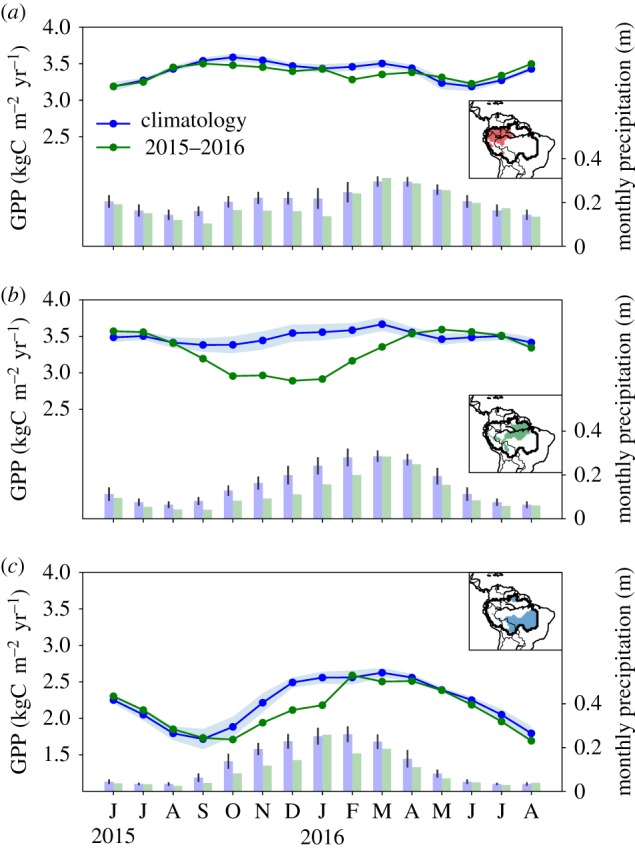
Monthly GPP for the El Niño period June 2015 to August 2016 (green line) for Region A (a), Region B (b) and Region C (c), in comparison with the average GPP climatology over the years 2007–2014 (blue line). Monthly precipitation values are shown for the El Niño period (green bars) and for the climatology over 2000–2014 (blue bars).