Figure 5.

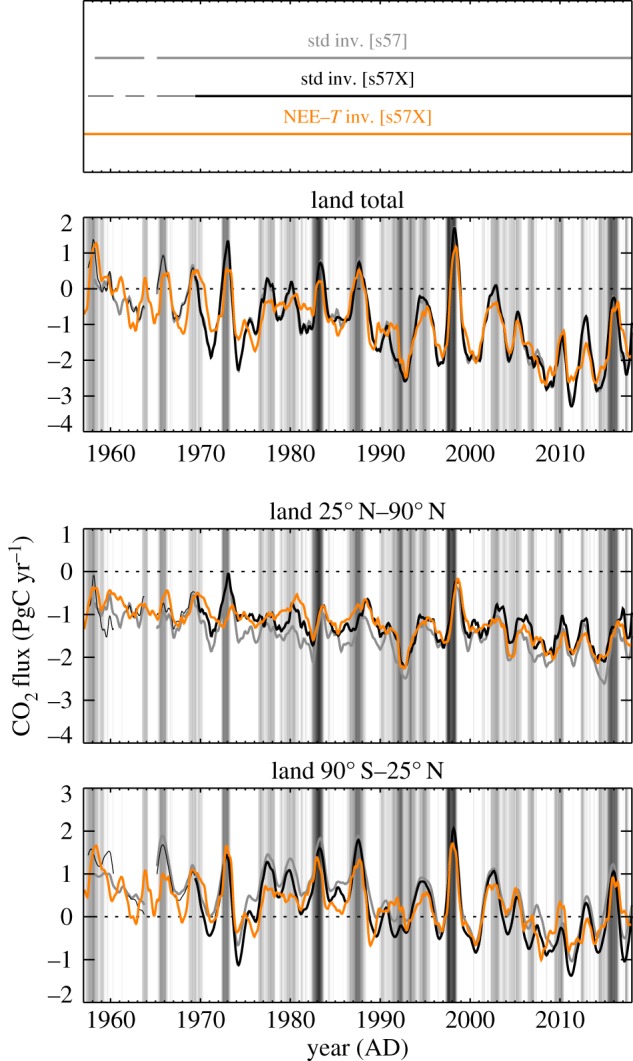
Interannual variations of NEE from standard and NEE–T inversions (IAV filtered/integrated as in figure 2). Black and orange runs use the ‘quasi-homogeneous’ station set s57X.

Interannual variations of NEE from standard and NEE–T inversions (IAV filtered/integrated as in figure 2). Black and orange runs use the ‘quasi-homogeneous’ station set s57X.