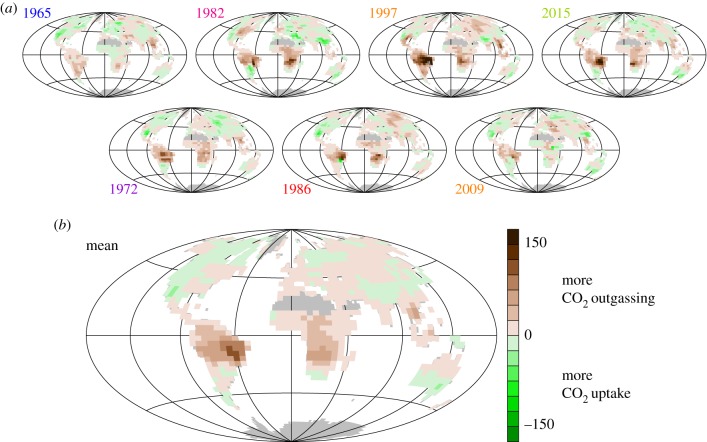
Figure 8.
Spatial signature of El Niño: NEE anomalies estimated by the NEE–T inversion with station set sEXT (interannual anomalies around the 1957–2017 linear trend, in gC m−2 yr−1). (a) Maps for the seven individual El Niño events with largest MEI [21] (taken at beginning of November 1965, January 1973, April 1983, August 1987, March 1998, March 2010 and January 2016). (b) Mean over these events.

