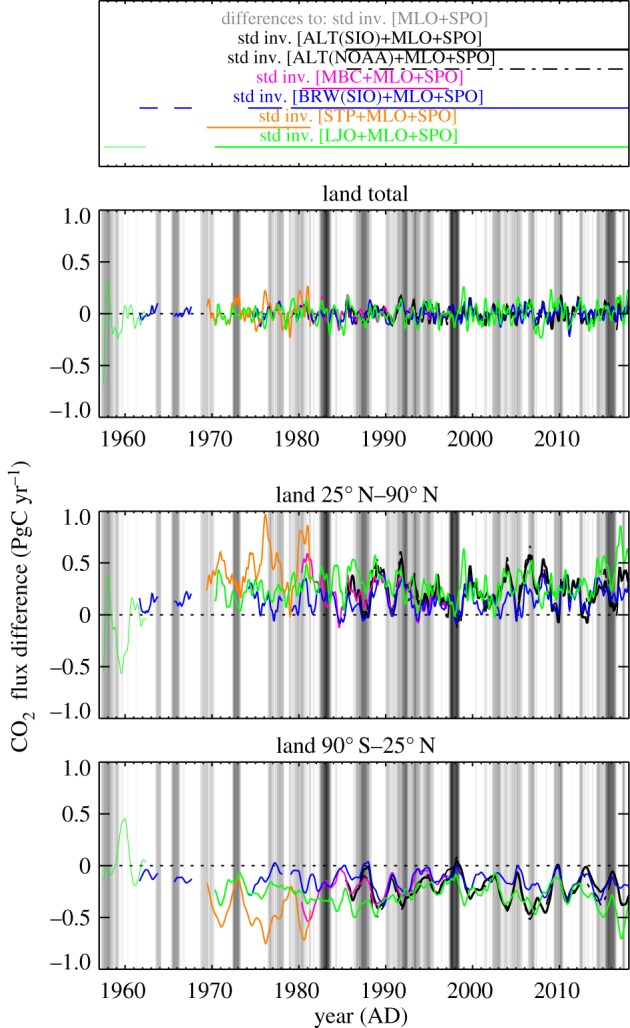
Figure 9.

Assessing the signals added to the inversion by various atmospheric CO2 records. Differences between the estimated interannual NEE variations from standard inversions using three stations (the test record in addition to MLO and SPO) and a reference standard inversion using two stations (MLO and SPO only). Though all runs were carried out over the same period (1955–2018), the results are only plotted over the time sections covered by all records involved.
