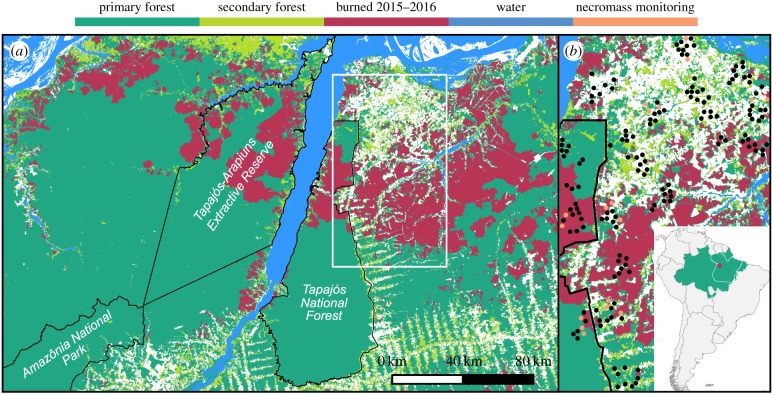
Figure 1.
(a) The 2017 land-use map across the approximately 6.5 Mha study region. (b) The land-use map within the RAS study area (shown by the white border in (a)). Also shown in this panel are the locations of the 107 study plots (black circles). The 18 of these that were used for necromass monitoring are shown as orange circles. The inset shows the Santarém study region (red circle) within South America, the Brazilian Amazon (green) and Pará (white border).

