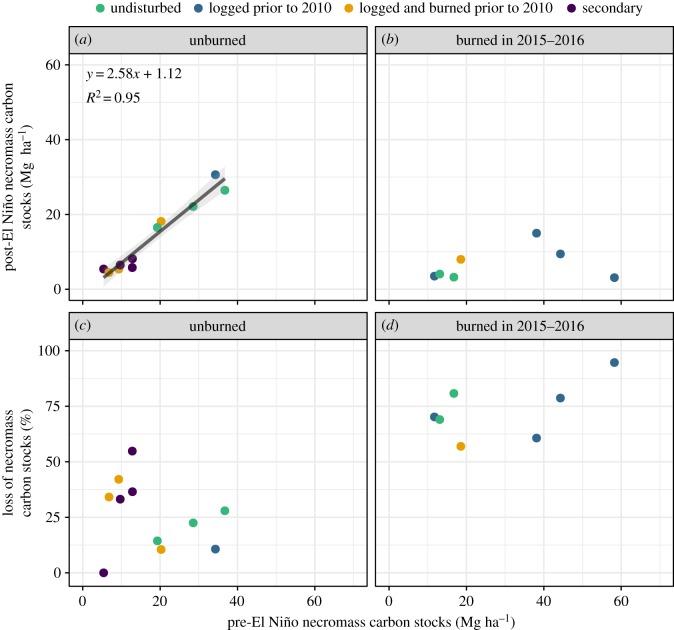
Figure 4.
Pre- versus post-El Niño necromass carbon stocks in unburned control sites (a) and sites burned in 2015–2016 (b), and pre-El Niño necromass carbon stocks versus post-El Niño necromass losses in unburned control sites (c) and sites burned in 2015–2016 (d) in human-modified Amazonian forests. In panel (a) the black line shows the significant (p < 0.001) relationship between pre- and post-El Niño necromass carbon stocks in unburned sites. The equation for this relationship is shown in the panel. The grey band represents 1 s.e.m. Note that, owing to data limitations, pre- and post-El Niño necromass totals are based on CWD, FWD and leaf litter only (i.e. dead-standing stems are not included).

