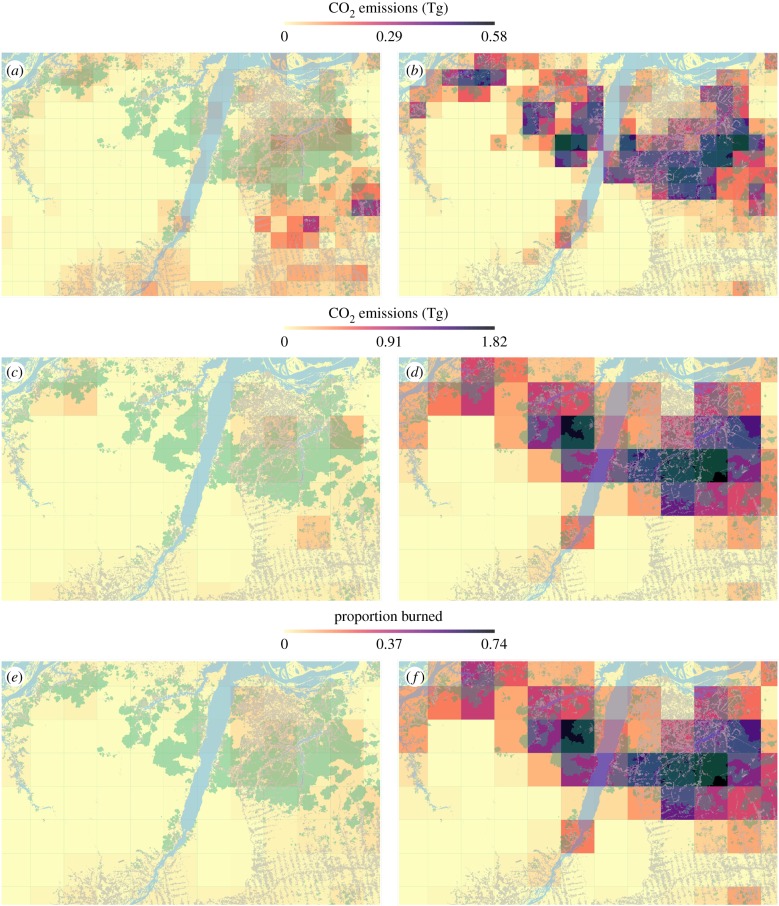
Figure 6.
Comparing our findings with those from GFAS and GFED. CO2 emissions for our study region and period from GFAS (a) and our emissions shown at the same scale (0.1°; (b)). CO2 emissions from GFED (c) and our emissions shown at the same scale (0.25°; (d)). The proportion of land burned for our study region and period from GFED (e) and our estimate of burned area shown at the same scale (0.25°; (f)). In all panels, our Landsat-derived fire map is shown in dark green, deforestation in light grey and water in blue.

