Fig. 3.
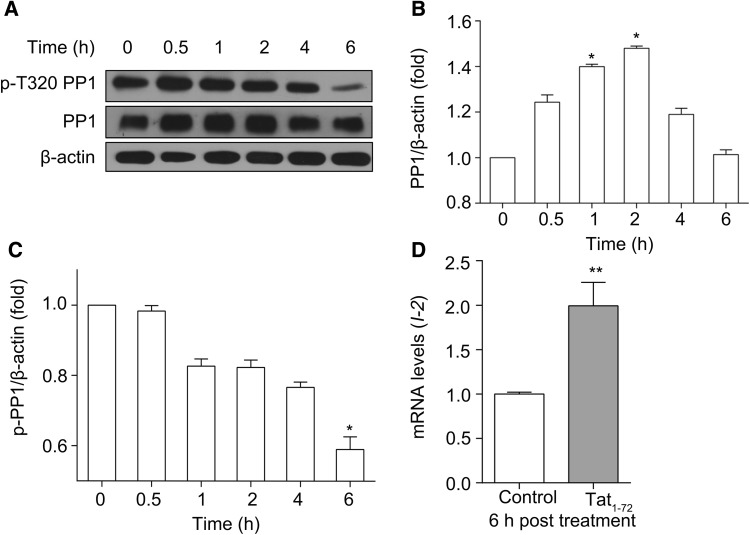
Tat1–72 modulates PP1 expression and activity. (A) Primary cultured neurons were treated with 2 μmol/L Tat1–72 for the indicated time. Then, the cells were lysed, and the lysate was subjected to western blotting. (B) PP1 expression was quantitatively analyzed. All data are from three independent experiments. Values are presented as mean ± SEM. *P < 0.05 versus 0 h group. (C) p-PP1 expression was quantitatively analyzed. All data are from three independent experiments. Values are presented as mean ± SEM. *P < 0.05 versus 0 h group. (D) Real-time PCR analysis of I-2 expression (relative to GAPDH expression) in cultured neurons treated with Tat1–72 (2 μmol/L) for 6 h. H2O (2.5 μL) used as a control. All data are from three independent experiments. Values are presented as mean ± SEM. **P < 0.01 versus the control group.

