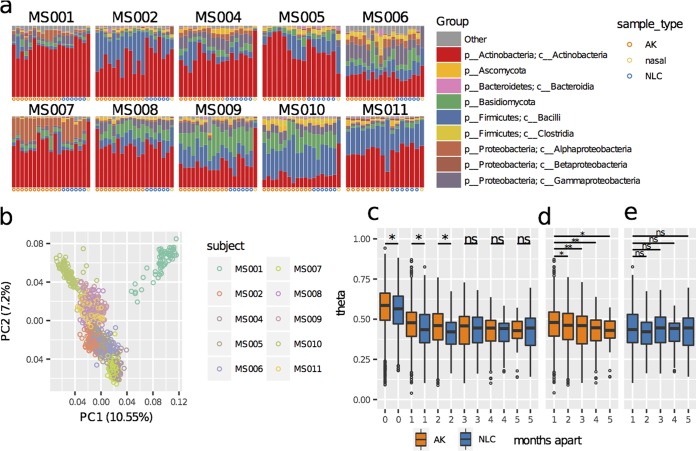
FIG 2.
Differences in skin microbiome profiles across subjects and time. (a) Bar plots of microbial relative abundances for the seven most abundant bacterial classes (prefixed with c) and the two most abundant fungal phyla (prefixed with p) aggregated across five monthly time points for each lesion (AK, orange dots at the base of each plot) and for photodamaged nonlesional controls (NLCs) from the extensor surface of the lower arm (blue dots) and nasal samples (mustard yellow dots). (b) PCA ordination indicates that samples separate primarily by subject. PC1 and PC2, principal components 1 and 2, respectively. (c) Community differences between months measured using the Yue-Clayton theta distance (18). As theta values approach 1.00, the communities are more similar. “months apart” indicates the similarity of the skin microbiome profiles for the same lesion over time, taken from 1 to 5 months apart. Profiles at 0 months apart are microbiome profiles of separate AK and NLC samples taken at the same time as a frame of reference for temporal differences. AK community profiles were more similar to those of other AKs on the subjects’ arms during the same time point than they were to the profiles from the same AK across time. AK community profiles were on average significantly more stable than NLC profiles in the first 3 months; however, the magnitude of difference was small. ns, not significantly different. (d) AK-only theta distances indicate a small but significant decrease in AK community similarity over time. (e) NLC community similarity did not significantly decrease over the same period.

