FIG 3.
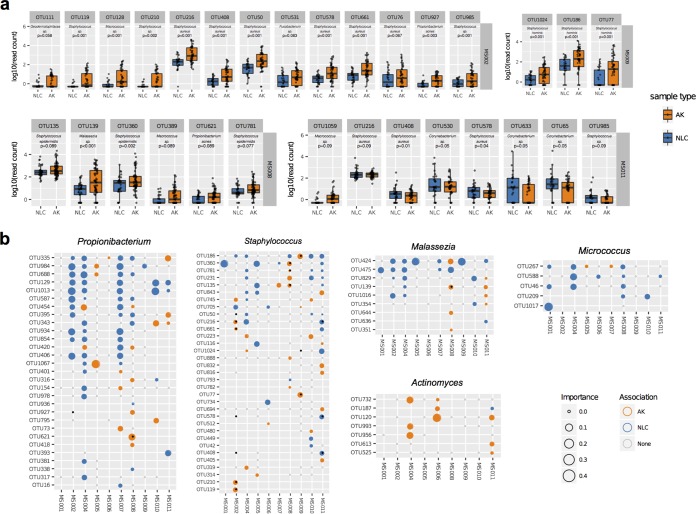
OTU associations with AK and NLC samples. (a) Boxplots showing the log10 read counts for 30 differentially abundant OTUs (adjusted log ratio test P value < 0.1), which were calculated with DESeq2 between AKs and NLCs for each subject. Staphylococcus OTUs were encountered frequently and were frequently higher in relative abundance in AK samples than in other samples. (b) Multivariate analysis using sPLS-DA identified sets of OTUs that maximally discriminate between AK and NLC samples for each subject. An OTU’s contribution to variation separating samples on both components of the model was used to determine sample type association. This method identified 707 OTUs associated with either AKs or NLCs across all subjects. Shown here are all OTUs associated with a sample type from five selected genera. Each circle represents an OTU tested in each subject. The color represents the sample type association, and the size of the circle is proportional to the sPLS-DA “importance” metric. Small open gray circles indicate that the OTU was testable in the subject but that no sample type association was identified. If no circle is present, the OTU did not have sufficient reads in that sample for testing. Black dots indicate that the OTU was differentially abundant in the univariate analysis. Propionibacterium was significantly enriched in NLC-associated OTUs (adjusted P value, 1.02e–8, chi-square test). Malassezia and Micrococcus were also enriched in NLC-associated OTUs; however, differences between these genera did not reach significance. OTUs highlighted with black dots were also identified as differentially abundant in the DESeq2 univariate analysis.

