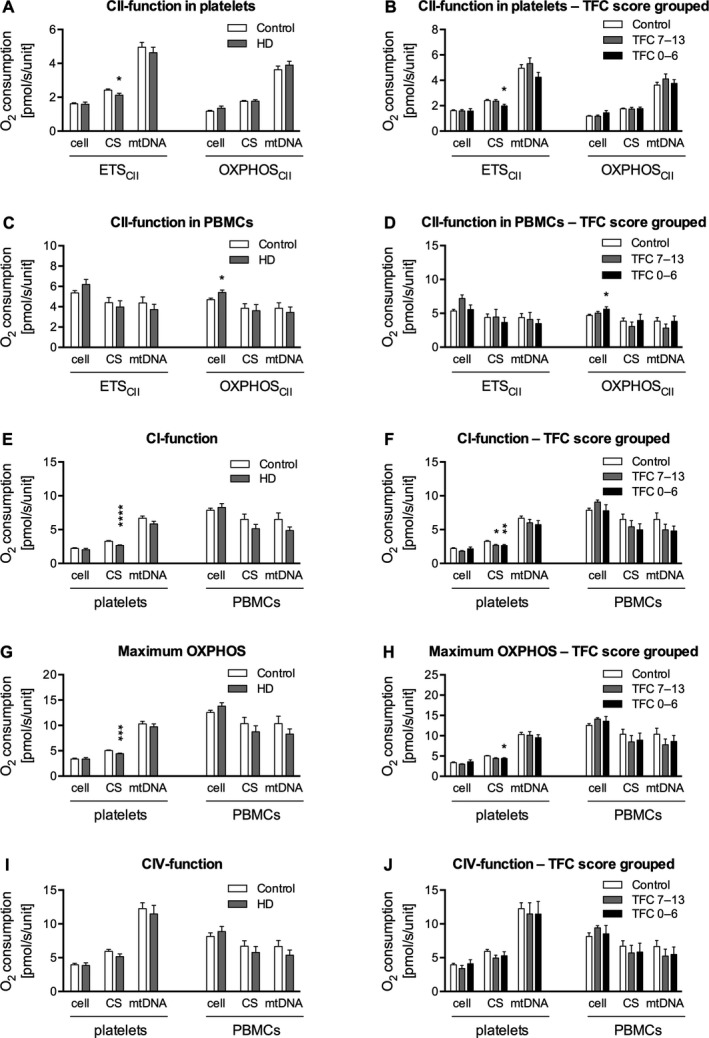
Figure 1.

A–J: Respiratory data are expressed either as pmol O2/second/10 × 106 platelets or 106 peripheral blood mononuclear cells (PBMCs) (oxygen consumption per cell), as pmol O2/second/(μmol citrate synthase [CS]/mL/minute) (oxygen consumption normalized for citrate synthase [CS] activity), or as pmol O2/second/109 mitochondrial DNA (mtDNA) copies (oxygen consumption normalized for mitochondrial DNA [mtDNA] copy number). All respiratory data are corrected for nonmitochondrial respiration. P values are from nonparametric Mann–Whitney U tests for comparisons of 2 groups and from nonparametric Kruskal–Wallis tests of variance with Dunn's post hoc test for comparison between all groups for analyses of 3 groups. The oxidative phosphorylation capacity (respiration associated with ATP synthesis by oxidative phosphorylation [OXPHOS]) for electron transport system complex II (CII) (OXPHOSCII) is calculated by subtracting the OXPHOS for electron transport system complex I (CI) with the addition of glutamate (OXPHOSCI [ MPG ]) from OXPHOSCI + CII. Data are presented as means and standard errors. ETS, respiration associated with maximal protonophore‐stimulated flux through the electron transport system; HD, Huntington's disease; TFC, total functional capacity; CIV, electron transport system complex IV.
