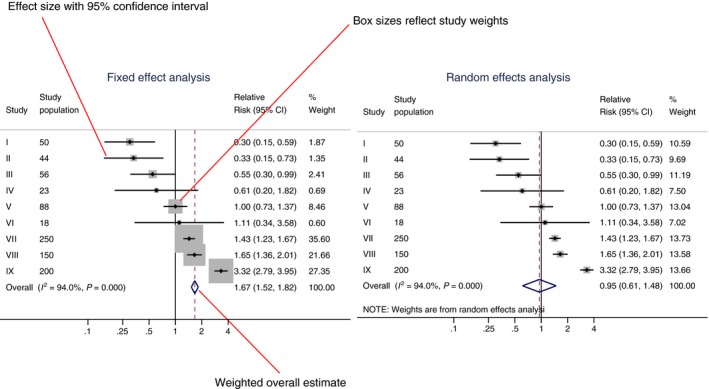
Figure 1.

Graphical display of a fixed and random effects model. Forest plot showing two different statistical meta‐analytic approaches for the same set of (fictional) studies: a fixed effect model (left) and a random effects model (right). In the forest plot effect estimates of individual studies, the study weights, a weighted overall effect and measures of heterogeneity (I 2 statistic and a P value for the heterogeneity test) are shown. CI, confidence interval
