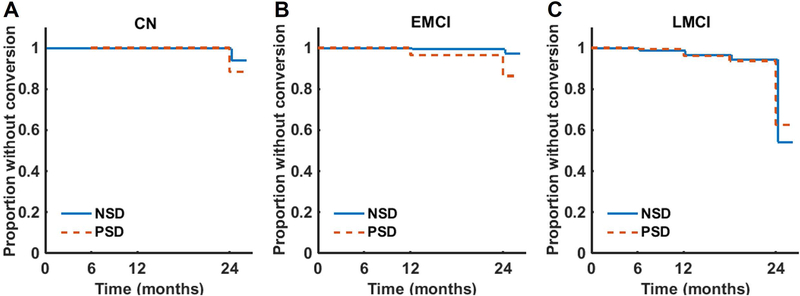
Figure 2: Conversion to a more impaired diagnostic group.
Survival curves were constructed using the Kaplan-Meier method. A Cox proportional hazards model was used to assess the time to conversion for individuals with a sleep disturbance (PSD) versus those without a sleep disturbance (NSD) prior to conversion. The model was adjusted for age, sex, APOE genotype, education level, and sedative/hypnotic use, as well as baseline ADAS-11 score to account for baseline disease stage. The confidence level for statistical inference was 95% (p < 0.05) and FDR correction was performed for multiple comparisons.

