
Figure 6:
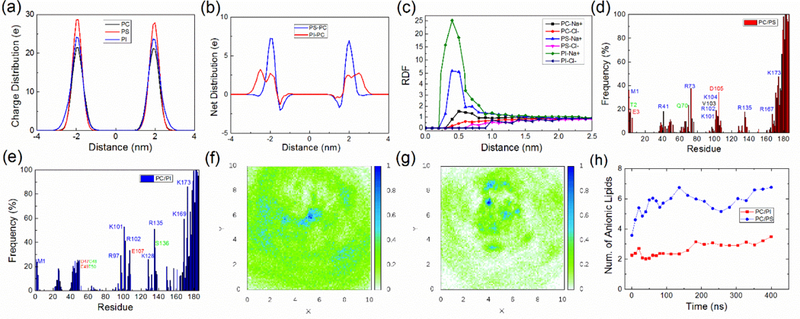
(a) Distribution of charges due to placement of phosphate in the lipid headgroups at the surface of the three model membranes in a 100 ns simulation (without protein). (b) Net distribution of charge of lipid head-phosphate groups in the POPC/POPS system or POPC/PIP2 system by subtracting the distribution of charges in the POPC system. (c) Radial distribution function of ions (sodium and chlorine ion) relative to the center of mass of the headgroup of a POPC, POPS or PIP2 lipid in the membrane only simulations. (d-e) Protein residues that are in frequent contact with the membrane for the POPC/POPS and POPC/PIP2 system respectively. The frequency is calculated by taking the time average of all the coordinate frames for each kind of membrane system. (f-g) show, respectively, the density of POPS or of PIP2 from the center of the K-Ras4A CD (density scaled to 1 for maximum). The CD is centered at (5.0 nm, 5.0 nm), and the direction vector connecting the center of CD and HVR is aligned in the direction of the X axis. (h) Charged lipid molecules gather within 2.5 nm of the center of the Ras CD (which itself has radius of gyration about 1.54 nm) in the POPC/POPS or POPC/PIP2 systems. See also Figure S4.