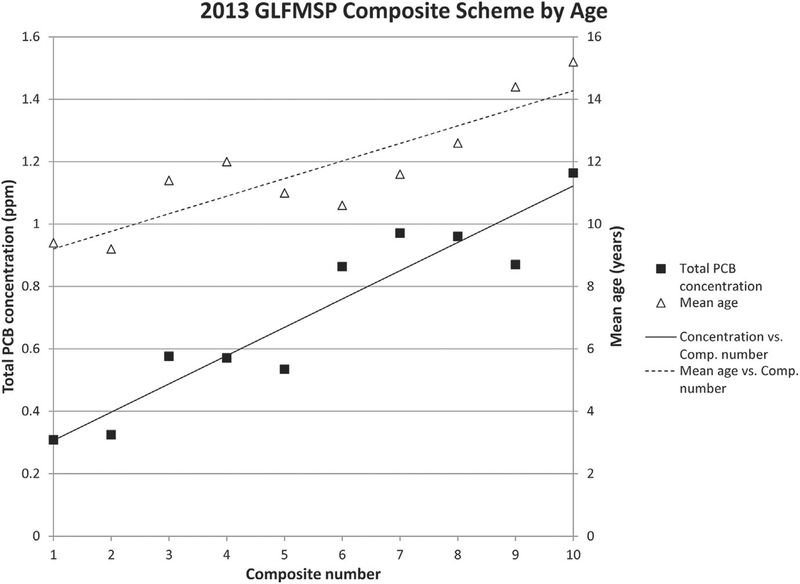
Fig. 4.
2013 Great Lakes Fish Monitoring and Surveillance Program lake trout compositing scheme by length from the Port Austin, Lake Huron site. Mean total PCB concentrations are represented by black squares and mean ages for individual composites are represented by black triangles. A linear trend is plotted for both mean total PCB concentration, solid line, and for mean age, dashed line. Lake trout composites are arranged according to similar fish age (youngest fish in first composite and age increases left to right) which was assessed prior to compositing. Correlation between PCB concentration and mean age is r = 0.80. The regression slopes are significant at the 95% confidence level for both concentration and age (2013 Total PCB concentration: t = 8.00, p < 0.0001 and 2013 Mean Age: t = 5.27, p = 0.0008).

