
Figure 4. Average AGI-30 Bioaerosol Concentrations as Measured at Each Location within the Shower Setup: A- B. diminuta Results, B- P. aeruginosa Results.
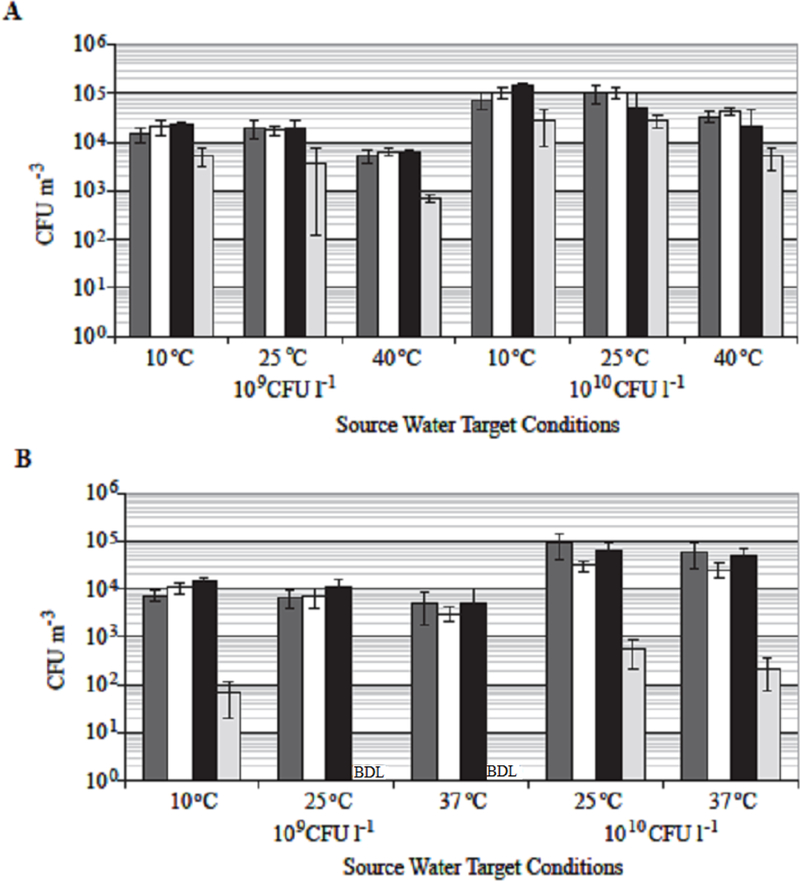
The error bars show the standard deviation of the results at each sampling location from the test runs conducted for each test condition. Below Detection Limit (BDL) - results were below the detection limit for the AGI-30 sampler. Coloring indicates sampler locations. Dark Gray: samplers collected through the probes In Front of the mannequin (n=4). White: samplers collected through the probes Behind the mannequin (n=3). Black: sampler located behind the mannequin Inside the shower stall (n=1). Light Gray: sampler located Downstream of the shower stall (n=1).