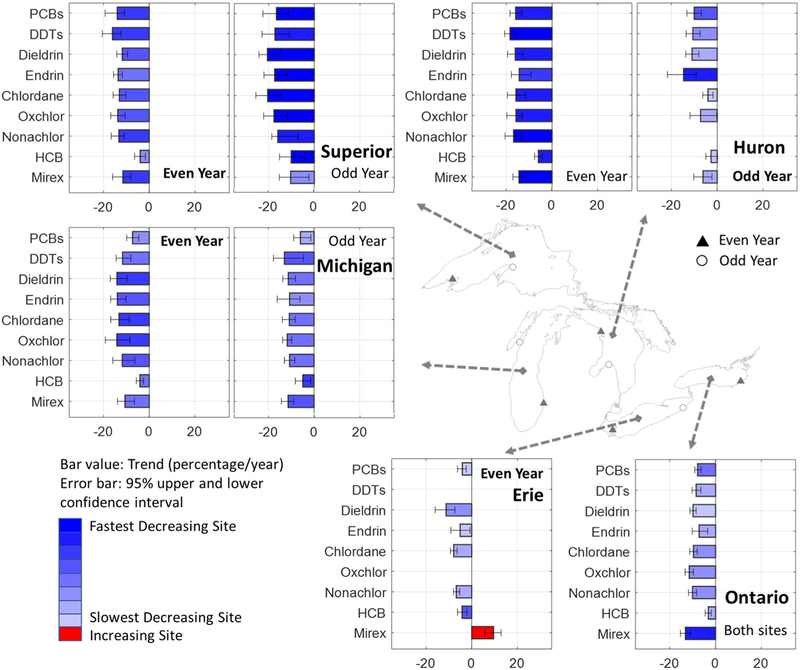
Fig. 5.
Kendall-Theil trends (bar) and confidence interval (error bar) after age normalization for legacy contaminants in GL region from 2004 (or after the break point) to 2014. A missing value indicates the most current trends are not significant. The bar values (x-axis) represent the Kendall-Theil trends (% per year), and the bar colors indicates the trends rank among the 10 sites. Note that a site name in bold font indicates the site with a more industrial influence for that lake. No trends are reported for LE odd year as not enough data were available (see text).

