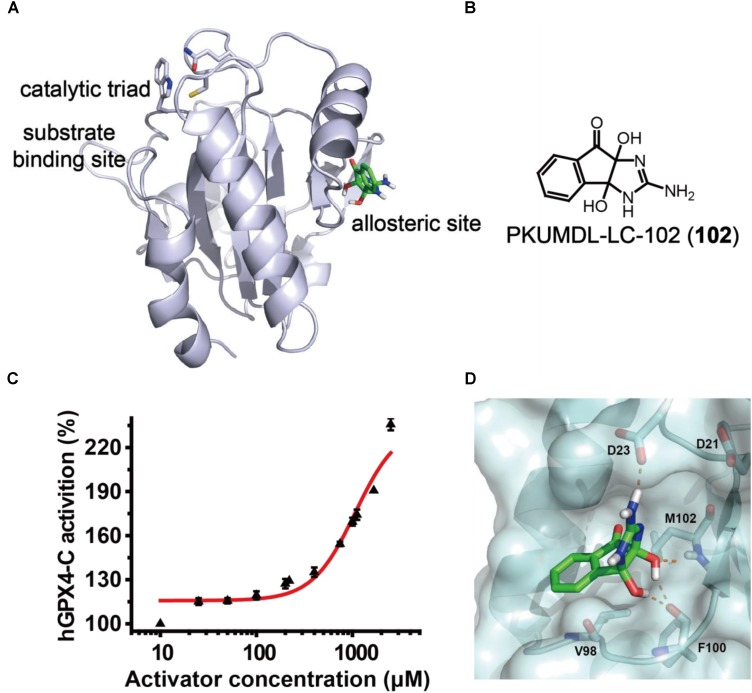
FIGURE 2.
GPX4 activator identification. (A) The predicted allosteric site using CAVITY and CorrSite is on the opposite side from the substrate-binding site across the protein. The catalytic triad C46, Q81, and W136 in the substrate-binding site are shown as sticks. The allosteric activator is shown in green. (B) Chemical structure of compound 102. (C) Dose–response curve for compound 102 in cell-free assay using hGPX4-C. Data shown represent the mean ± standard error of mean (SEM; n = 6). (D) Predicted binding mode of compound 102. The hydrogen bonds between the activator (green) and hGPX4-C (pale cyan) are shown as orange dashed lines.

