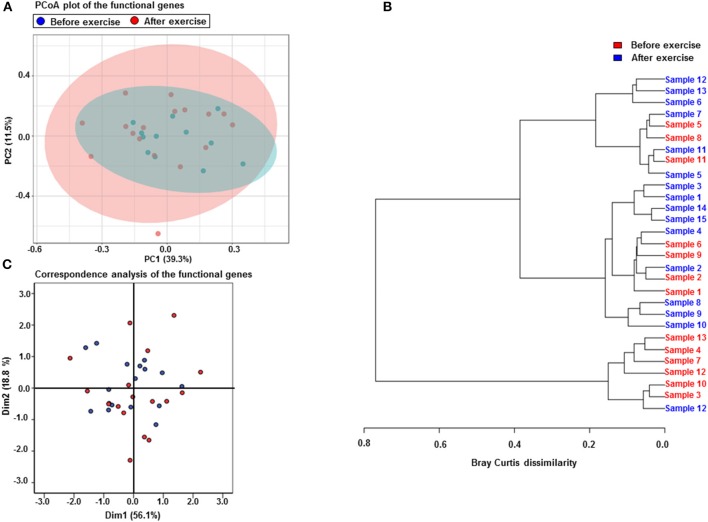
Figure 4.
Exercise training increases the variability of the functional genes but only half of the subjects microbiomes respond to exercise. (A) PCoA plot of the functional genes shows that the samples before (n = 15) and after (n = 15) the exercise cluster closely together indicating their similarity. The first component explains 39.3% and the second 11.5% of the variability. (B) The Correspondence analysis of the functional genes shows that the samples before the exercise are less variable (more close to the centroid) than the samples after the exercise training indicating that the exercise has caused shifts in the gene abundances. (C) The Bray Curtis dissimilarity analysis shows that only approximately half of the subjects microbiomes have considerably responded to the exercise training, i.e., have Bray Curtis index close to 0.8.

