
Figure 6.
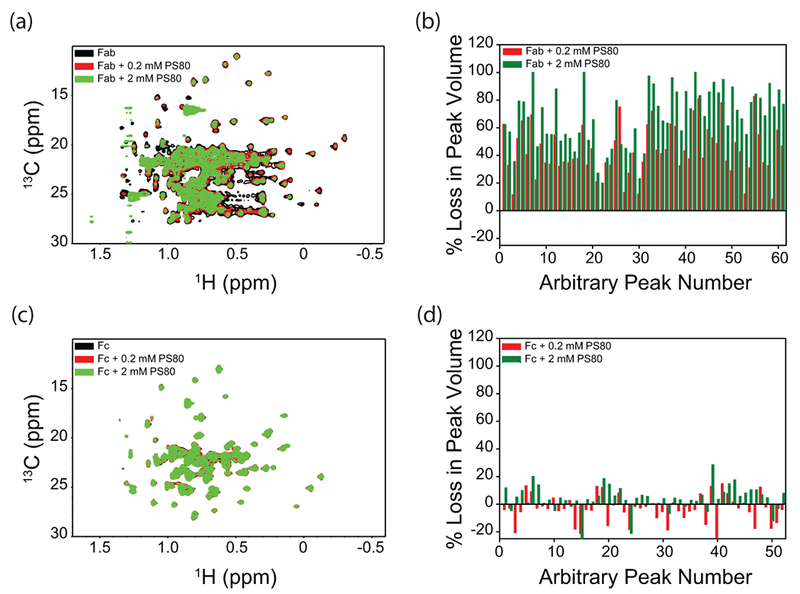
Effect of PS80 on the NMR spectra of isolated Fab and Fc fragments of mAb. Panels (a) and (c) show the NMR spectra, and panels (b) and (d) show the loss of volumes of individual crosspeaks. Peaks were arbitrarily numbered because of the unavailability of assignments. Black, red, and green represent the data in the absence of PS80, with 0.2 mM PS80, and with 2 mM PS80, respectively.