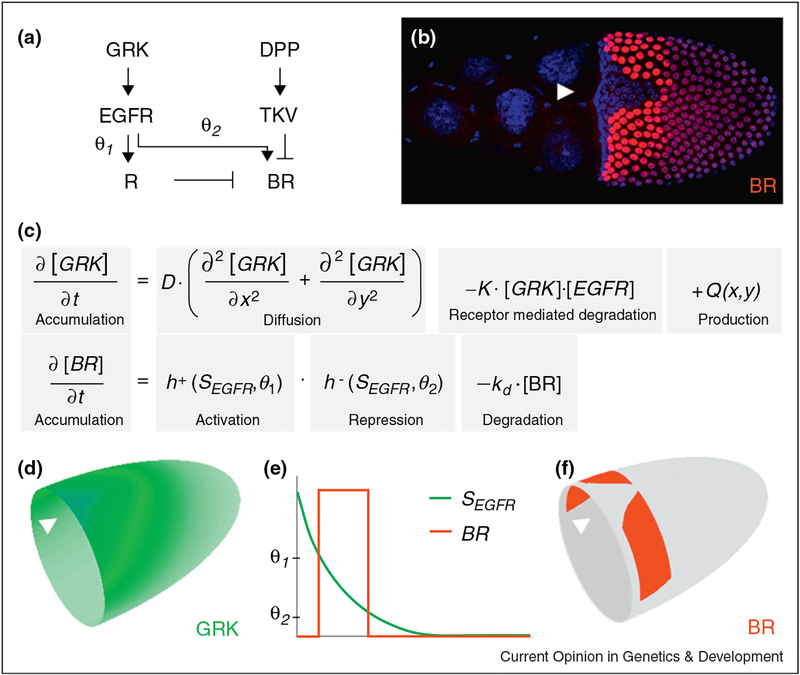
Figure 2.
Model for the regulation of the expression pattern of broad (br). (a, e) The EGFR pathway regulates br in an incoherent feedforward loop, where EGFR activation induces both br (at a low threshold value θ2) and its repressor R (at a higher threshold value θ2). (b) BR (red) is expressed in two groups of follicle cells (nuclei shown in blue) on either side of the dorsal midline, (c–f) Mathematical model for the two-dimensional distribution of GRK and BR expression. Arrow heads mark the position of the dorsal midline.

