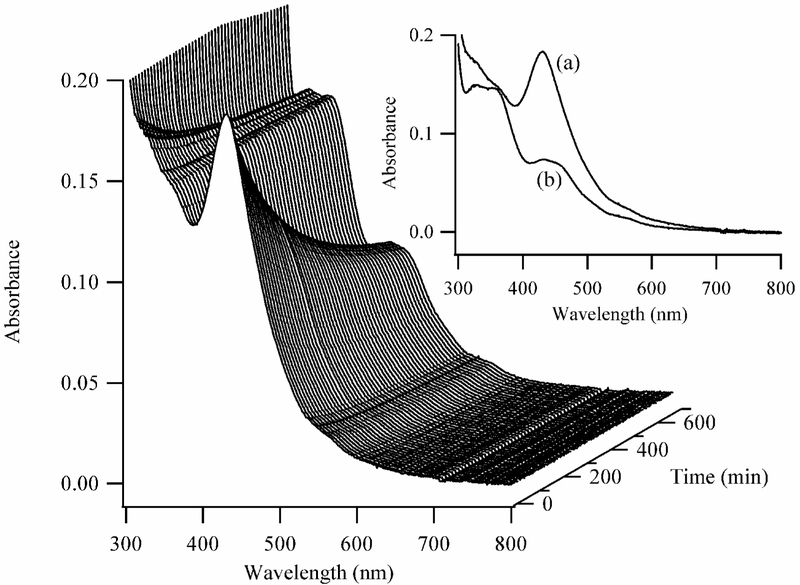
Figure 3.
Absorption spectra acquired as a function of time (right axis) for the clusters bound to dT12. The first spectrum in the series was acquired 2 min after the addition of BH4−, and subsequent spectra were acquired at 7 min intervals. The inset shows the spectra of the clusters acquired at 7 (a) and 700 (b) min after the reaction was initiated.

