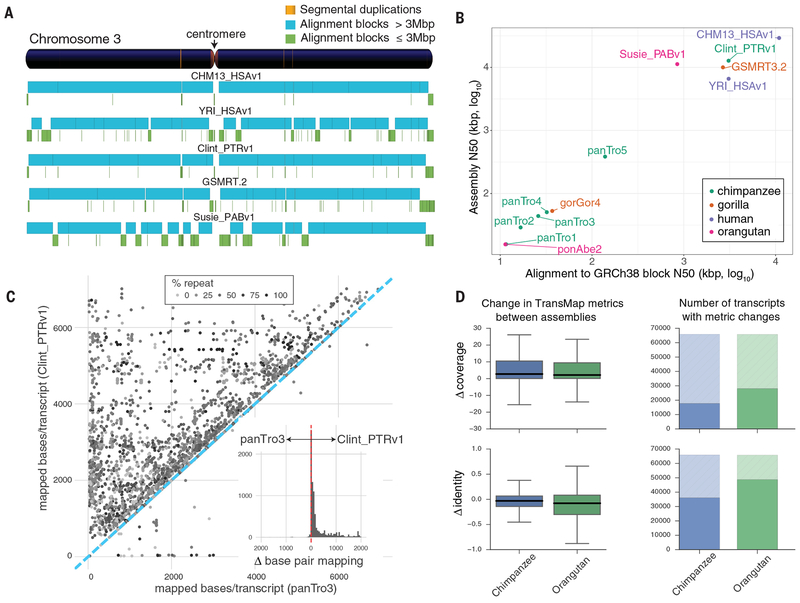
Fig. 1. Assembly and annotation of great ape genomes.
a) Comparison of genome sequence contiguity. Chromosome 3 contiguity is compared among the great ape genome assemblies by alignment to GRCh38. Contigs larger (blue) and smaller (green) than 3 Mbp are compared with the position of segmental duplications (SDs >50 kbp, orange) shown in the reference ideogram. b) Scatterplot of syntenic-alignment block lengths (x-axis) against GRCh38 vs. contig N50 (y-axis) of the great ape assemblies. The SMRT assemblies are Clint_PTRv1, Susie_PABv1, GSMRT3.2, CHM13_HSAv1, and YRI_HSAv1. The previous reference genomes are ponAbe2 (GCF_000001545.3), gorGor4 (GCA_000151905.3), panTro2 (GCF_000001515.2), panTro3 (GCA_000001515.3), panTro4 (GCA_000001515.4), and panTro5 (GCA_000001515.5). c) Full-length assembled transcripts mapped to Clint_PTRv1 and panTro3. Each point denotes the number of bases/transcript matching the two assemblies. Repeat content is indicated by gray shading of the points. While the majority of transcripts map well to both assemblies (Pearson’s correlation = 0.95), the subset of differentially mapped transcripts (12,724; 60% of 21,118) aligns better to Clint_PTRv1 (dots above the blue dashed line). The histogram inset shows the effect, per transcript, with a total of 4.8 Mbp more bases aligned to Clint_PTRv1. d) Comparative Annotation Toolkit (CAT) was used to project transcripts from GRCh38 to Clint_PTRv1, panTro3, Susie_PABv1, and ponAbe2. Alignment coverage and identity were compared for orthologous transcripts found in each assembly pair. The boxplots (left) summarize TransMap differences between the short-read and SMRT assemblies in terms of coverage and identity. The shaded portion of the bar plots (right) represents alignments, which had identical coverage or identity in both assemblies.

