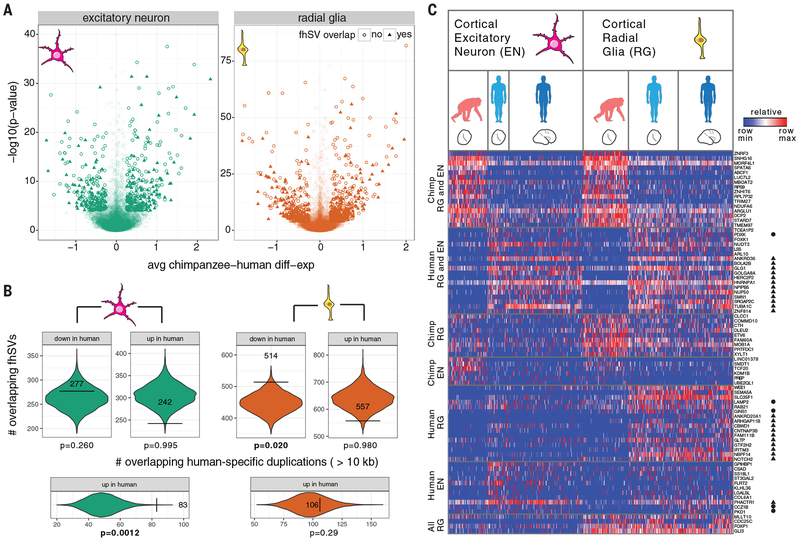
Fig. 6. Structural variation and neural progenitor expression differences between human and chimpanzee.
a) Volcano plots for chimpanzee–human gene expression in excitatory neuron (left) and radial glia (right) organoid single-cell data. Each point represents a gene, with sufficient data to assess significance between human and chimpanzee organoid cells. Genes with fhSVs within 50 kbp are denoted with a triangle. The data points are shaded by significance. b) Spatial permutation test for overlap between fhSVs and differentially expressed genes. Each violin shows the null distribution of human-specific SV overlap (+/−50 kbp of transcript start/end) with genes that are significantly differentially down or upregulated, relative to chimpanzee. The horizontal bars and observed counts are overlaid upon the null distribution. c) Heatmap illustrating the percentile gene expression of differentially expressed genes near fhSVs (rows) across single cells (columns), including genes near the start or end of inversions (circle) and duplicated regions (WSSD) (triangle). Cells include 333 excitatory neurons (97 chimpanzee organoid; 53 human organoid; 183 human primary cells) and 373 radial glia (113 chimpanzee organoid; 123 human organoid; 137 human primary cells) (56, 57). Expression patterns include concerted changes between chimpanzee and human cells across radial glia and excitatory neurons (chimpanzee RG and EN; human RG and EN), cell-type-specific changes (human EN; human RG) and conserved radial glia expression (pan-RG).

