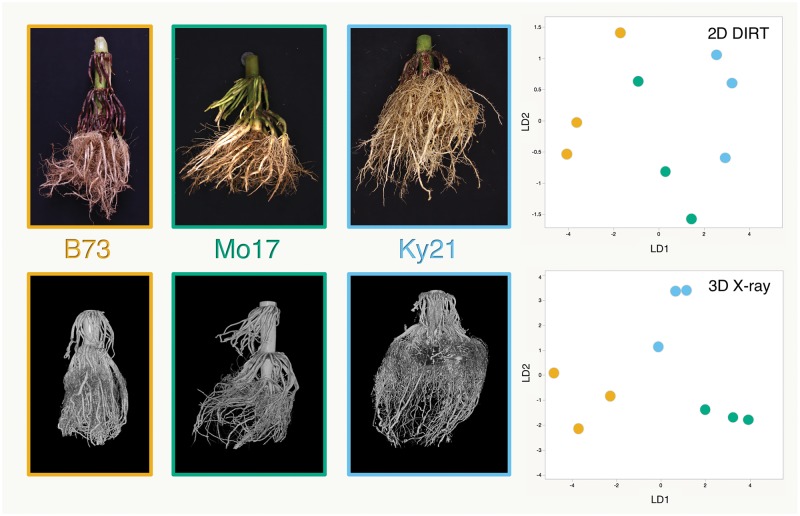
Fig. 1.
Comparison of 2D images (top) and 3D X-ray computed tomography (XRT) scans (bottom) of maize root crowns excavated from the field at tasseling. Differences between ‘B73,’ ‘Mo17’ and ‘Ky21’ from the images are visually apparent, showing the narrower, denser habit of ‘B73’ and ‘Ky21’ compared with ‘Mo17’; however, LDA of 2D DIRT traits does not entirely discriminate these genotypes (top right). Additional information gathered from 3D XRT scans and 3D GiaRoot traits group these genotypes in LDA (bottom right). These data are a subset of three excavated root crowns from three maize inbred lines collected at tasseling from a larger experiment conducted at our field site at University of Missouri Genetics Farm, Columbia, MO.

