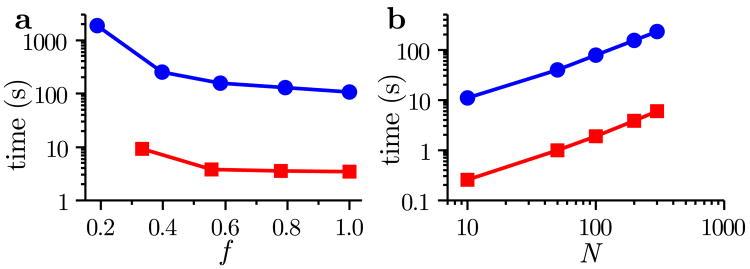
Figure 13.
Computational complexity of solving the nonlinear least-squares problem defined by equation (10). The computational complexity is shown for the H2/O2 (■) and GRI-Mech 3.0 (●) networks as a function of (a) the fraction of the observed nodes f and of (b) the observation horizon N. In panel a the results correspond to an average of 100 samples of randomly selected sensors and N = 200, whereas in panel b the results correspond to f = 0.6. In both panels, the results are obtained for the IRK model and h = 10−13.

