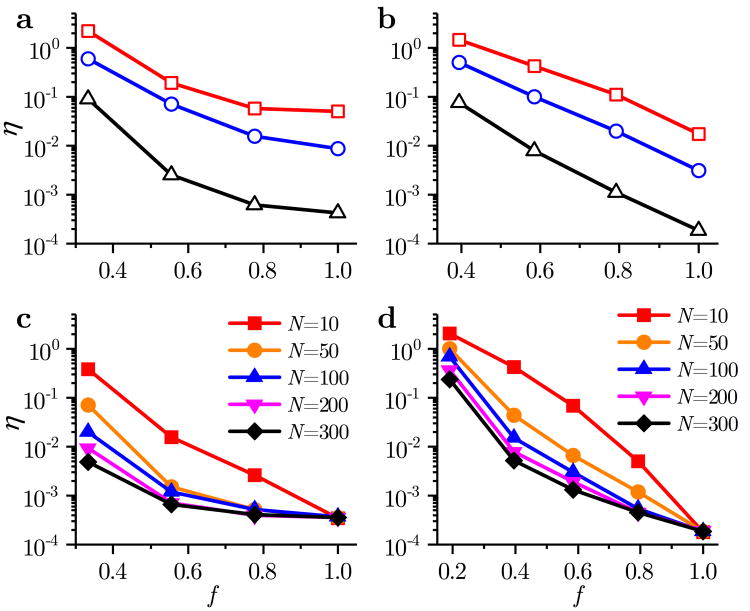
Figure 4.
Estimation error η as function of the sensor fraction f and observation length N. Results for the (a, c) H2/O2 network and (b, d) GRI-Mech 3.0 network. Panels a and b compare the three models (Δ-IRK, ○-TI, and □-BE) for N = 50, whereas panels c and d compare different N for the IRK model. Each data point is an average over 100 realizations of the random sensor placement and initial guesses of the solution in the GRI-Mech 3.0 network and over all possible placement configurations in the H2/O2 network. The discretization step was h = 10−13 in all simulations.

