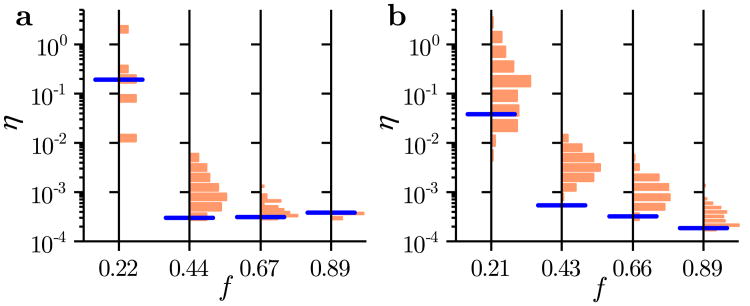
Figure 5.
Optimal sensor selection for the combustion networks. Estimation error η for the (a) H2/O2 network and (b) GRI-Mech 3.0 network. For each network and sensor fraction f, the histogram presents η for an exhaustive calculation in panel a and for 100 realizations of the random sensor placement in panel b. The blue line marks the estimation error for the calculated optimal sensor selection. The results are generated using the IRK model for N = 200 and h = 10−13.

