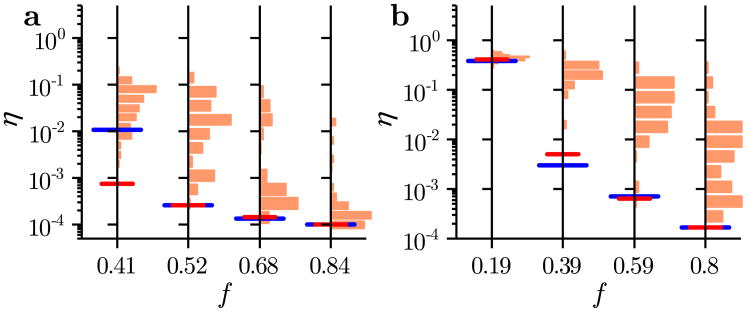
Figure 8.
Optimal sensor selection for the biological networks. Estimation error η for the (a) CD network and (b) SS network. For each network and sensor fraction f, the histogram presents η for 100 realizations of the random sensor placement. The blue line marks the estimation error for the calculated optimal sensor selection; the red line indicates the corresponding result when information about the OID is ignored. The results are generated using the IRK model for N = 100 and h = 0.02 in panel a, and for N = 100 and h = 0.05 in panel b.

