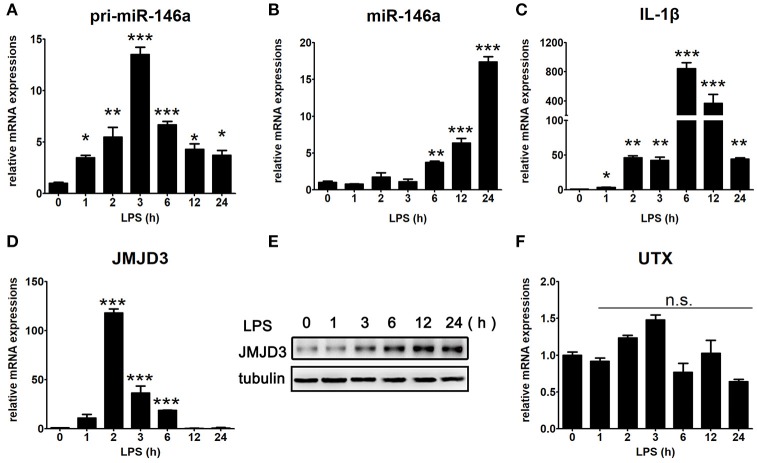
Figure 3.
Time specific expression pattern of inflammatory factors under LPS stimulation in macrophages. Raw264.7 cells were treated with LPS (100 ng/mL). The mRNA expression levels of pri-miR-146a (A), miR-146a (B), IL-1β (C), JMJD3 (D), and UTX (F) in Raw264.7 were determined by quantitative PCR. (E) The protein expression level of JMJD3 was determined by Western blotting. Data are shown as mean ± SEM (n = 3). *P < 0.05; **P < 0.01; ***P < 0.001.

