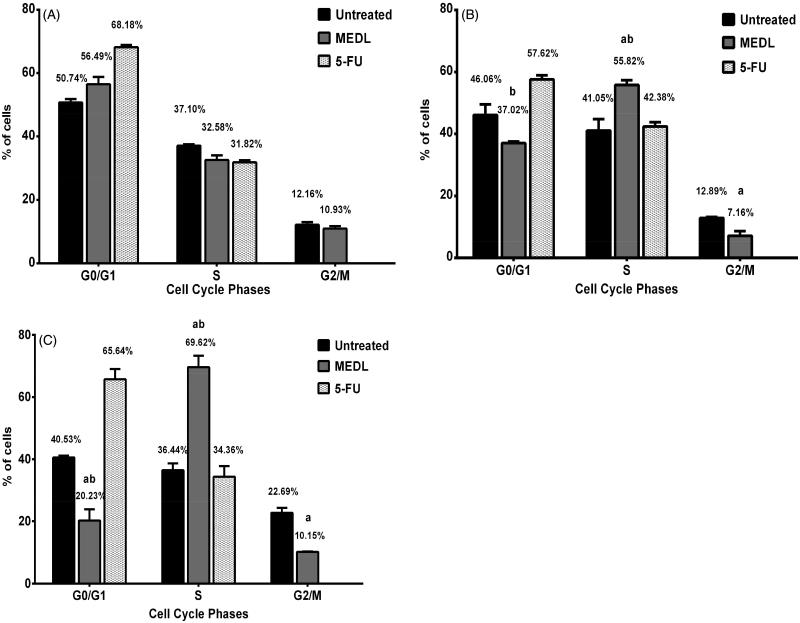
Figure 8.
Record of flow cytometry data for cell cycle analysis. The phases of the cell cycle were determined in MDA-MB-231 cells following treatment with MEDL for 24 h (A), 48 h (B) and 72 h (C) in comparison to the untreated cells and 5-FU treated cells. Data are presented as mean ± standard error (n = 3). aStatistically significant (p < 0.05) compared to the untreated cells. bStatistically significant (p < 0.05) compared to the 5-FU treated cells.

