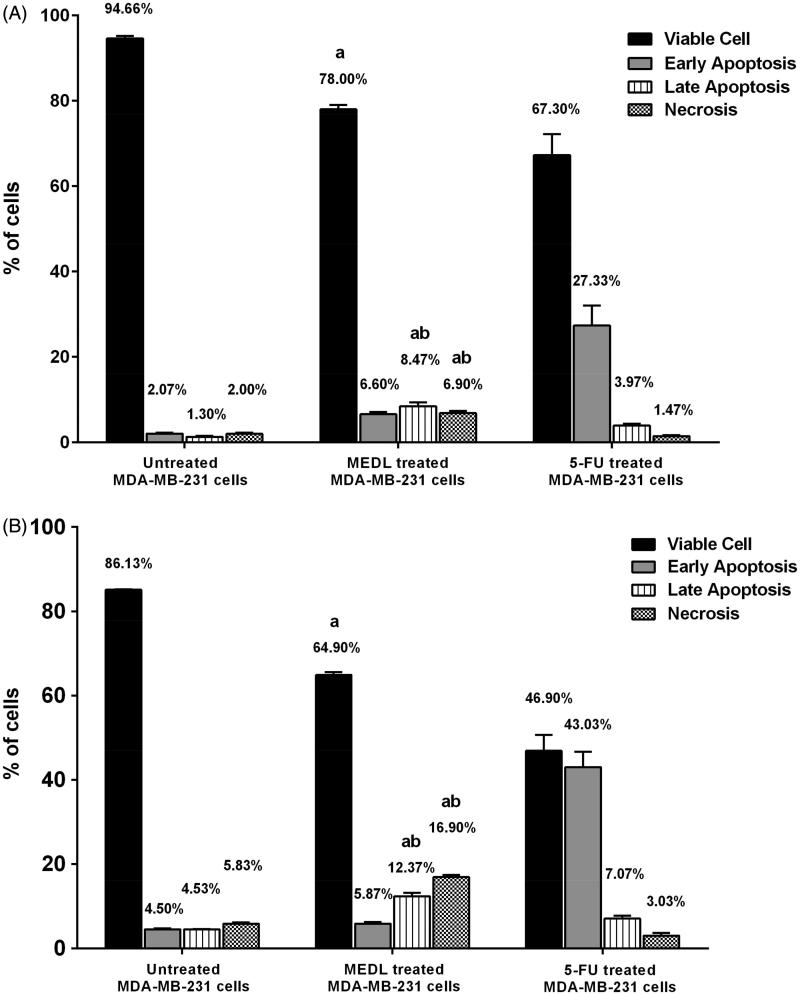
Figure 10.
Apoptosis study of MDA-MB-231 cells exposed to MEDL at IC50 value. The distribution of cells undergoing early and late apoptosis together with viable and necrotic cells following treatment with MEDL for 24 h (A) and 48 h (B) in comparison with respective control using Annexin-FITC and PI flow cytometric analysis. The values are presented as mean ± standard error of mean of three determinations, and where indicated by: (A) showed a significant difference (p < 0.05) relative to the untreated cell; (B) showed a significant difference (p < 0.05) relative to the 5-FU-treated cell.

