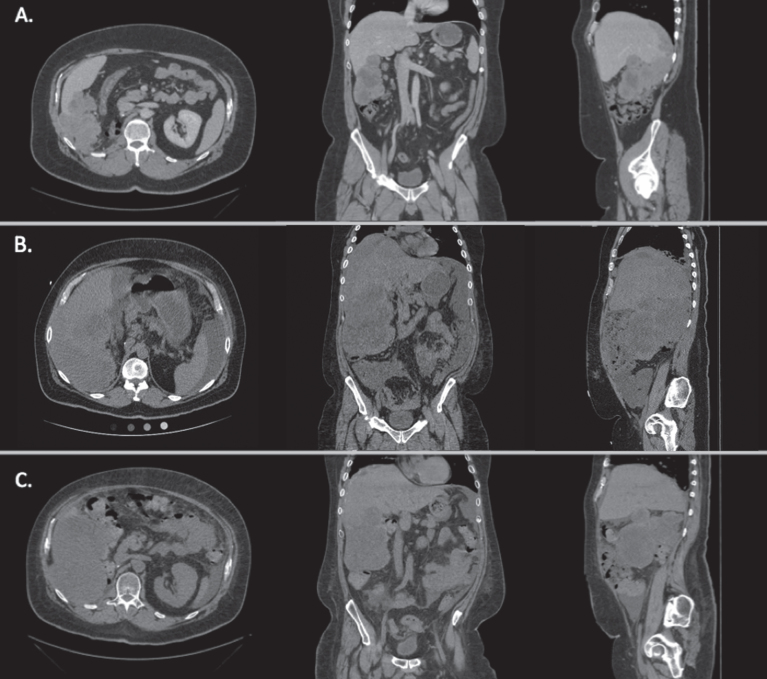
Fig.1.
Axial, coronal, and sagittal CT images of the patient’s abdomen and pelvis revealing metastatic disease at different time points during his therapy. A. Prior to sunitinib and gemcitabine therapy. B. After sunitinib and gemcitabine therapy, prior to nivolumab therapy and one month prior to admission. C. 47 days after admission. Image shown after nivolumab and during everolimus therapy. Overall response was mixed as compared to prior to everolimus therapy.

