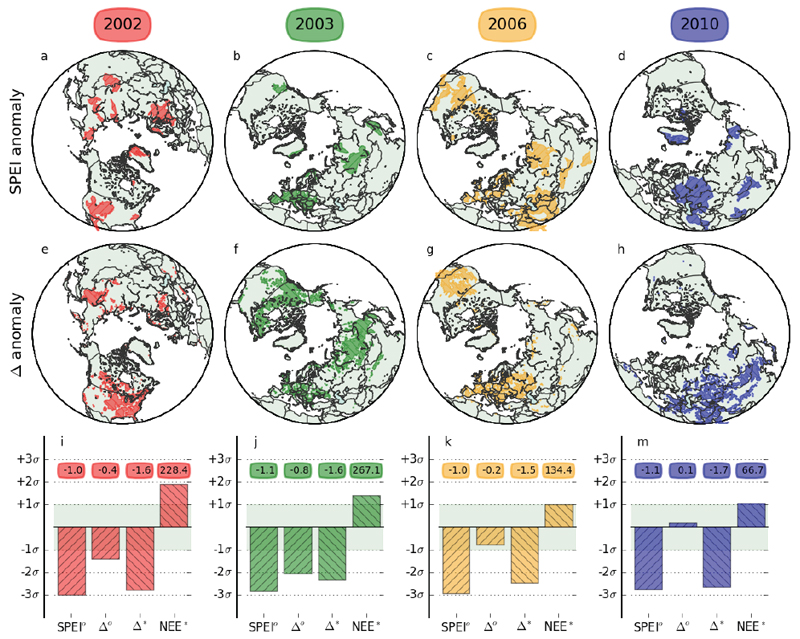
Figure 2.
Severe droughts in the period 2001-2011 as recorded independently in the SPEI index (< -1.0, top row) and in the estimated discrimination of vegetation against 13CO2 (Δ anomalies, middle row). Colored areas experienced anomalies >1-σ relative to the 11-year mean. Shown are the summer (JJA) droughts in (a and e) North America 2002, (b and f) Europe 2003, (c and g) Europe 2006, and (d and h) Russia 2010. (i-m) shows the JJA integrated anomalies in SPEI index, Δ, and NEE divided by their standard deviation. Symbols (o) or (*) denote integration over the contours shown in the top (a-d) or middle row (e-h) respectively. Labels show the absolute anomalies in units of [-], [‰], [‰], and [TgC/yr].

