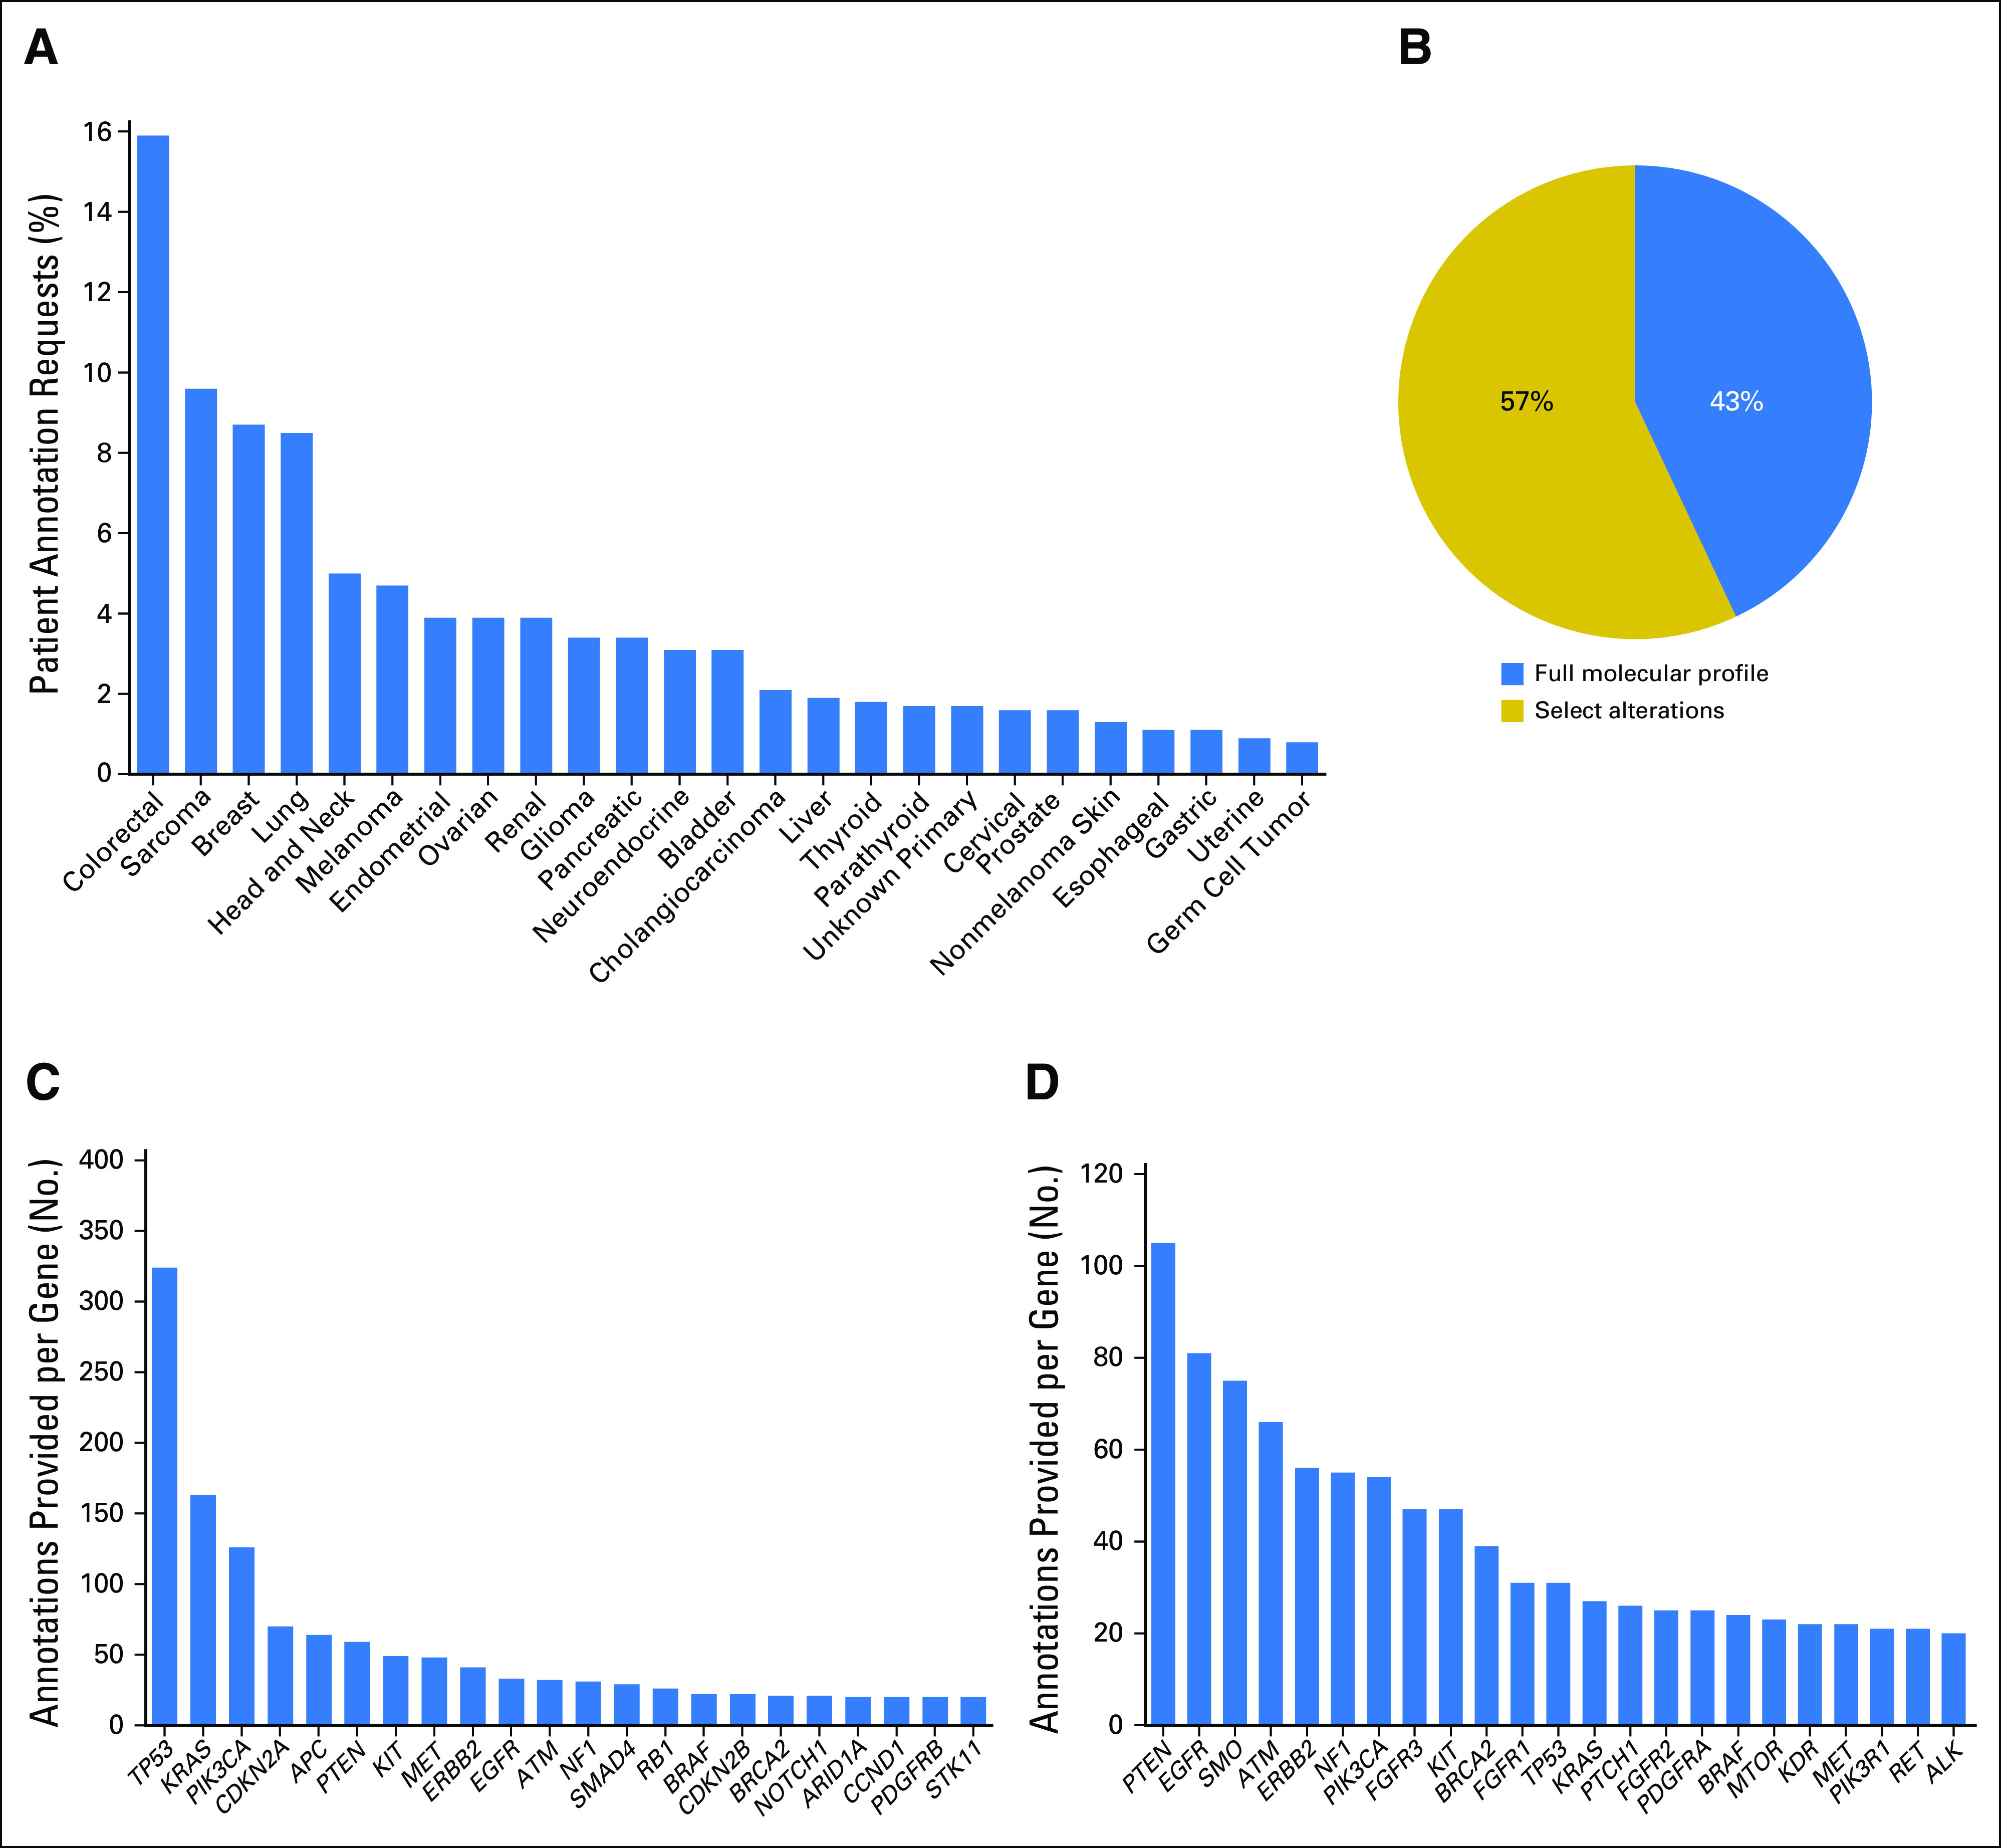
Fig 1.

Requests received and annotations provided. The percentage of requests is shown for (A) each indicated tumor type (top 25) and (B) annotation type (full panel or select alterations). The number of annotations provided within each gene is shown for (C) full panel or (D) select alteration annotations. Genes with 20 or more annotations are shown.
