
Figure 3. Further comparisons of MPSA measurements across three different contexts.
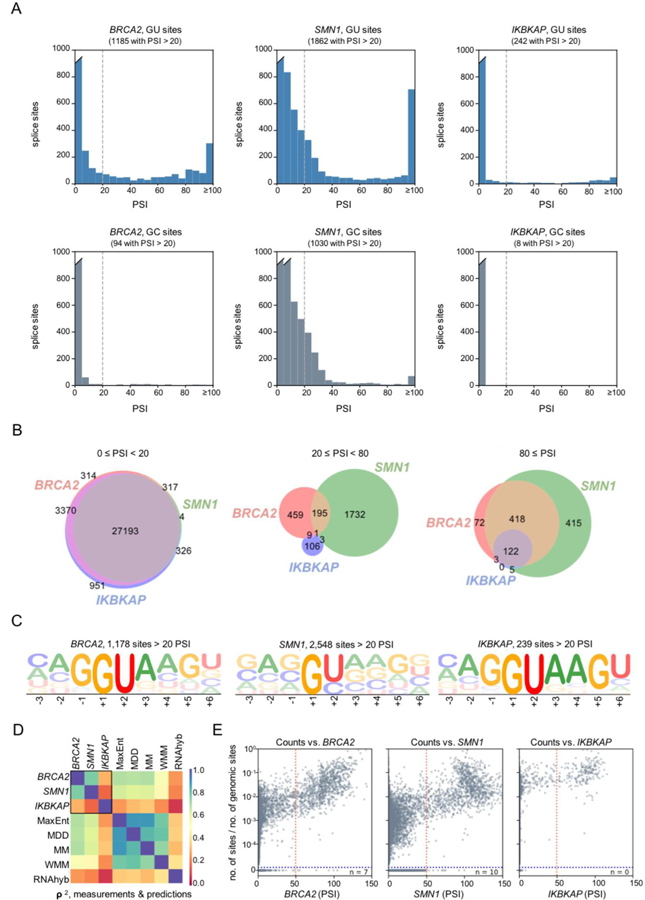
(A) Histograms showing the distribution of PSI measurements for all GU (top) and GC (bottom) 5′ss sequences in each of the three minigene contexts. The dashed line marks the 20% cutoff used to designate a 5′ss as active. The breaks in the left-most bars (indicated by a slant mark) indicate values exceeding the upper limit on the y-axis. PSI measurements above 100 were included in the right-most bar in each plot.
(B) Venn diagrams showing contextual overlap in the number of 5′ss with activities in the ranges 0–20, 20–80, or 80–100 PSI. A complete 9×9 table of such overlaps is provided in Figure S5A.
(C) Sequence logo generated from 5′ss sequences with PSI ≥20 in each context. Separate sequence logos for each independent-replicate library are shown in Figure S5B–D.
(D) Heat map showing squared Spearman rank correlation values (ρ2) between the PSI measurements in each minigene context, and the predictions of previously published models, including: a maximum entropy model (MaxEnt; Yeo et al., 2004), a maximum dependence decomposition model (MDD; Burge et al., 1998), a first-order Markov model (MM; Krogh et al., 1994), a weight matrix model (WMM), and RNAhybrid predictions (RNAhyb; Kruger et al., 2006). Scatter plots for MPSA/model comparisons are shown in Figure S6A.
(E) Scatter plots comparing the occurrence of each 5′ss in the human transcriptome, normalized to the occurrence of the respective 9-mer in the genome, to our measured PSI values. Here “n” indicates the number of 5′ss sequences with >50 PSI (left of the red dotted line) that do not occur in the human transcriptome (below the blue dotted line). A higher cutoff of PSI >50 (marked by the red dash line) was chosen to disregard the population of 5′ss with low activity seen only in the SMN1 context. See also Figure S6C.