
Figure 4. Epistatic interactions in 5′ss activity.
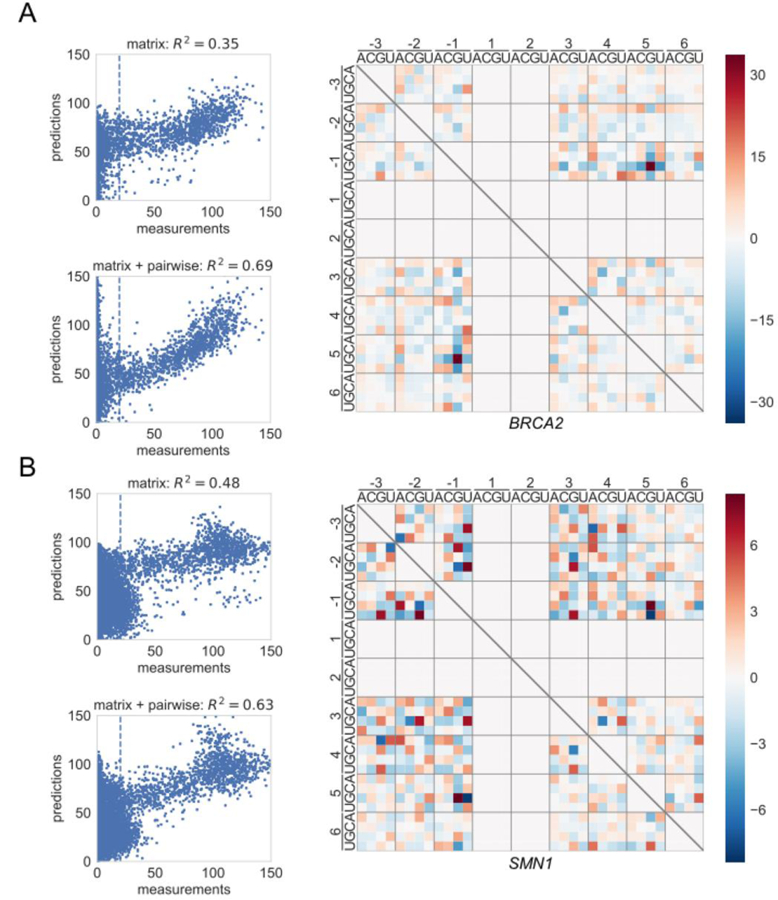
(A) Scatter plots showing measured PSI values vs. PSI values predicted by either the matrix model (top) or the matrix + pairwise model (bottom) for BRCA2. The heat map shows the specific interactions present in the pairwise model. Red indicates a positive interaction; blue indicates a negative interaction. Note that pairwise models were inferred only for GU splice sites. Analyses for each separate library are shown in Figure S7C.
(B) Same as A, but for SMN1. See also Figure S7D.