
Figure 1.
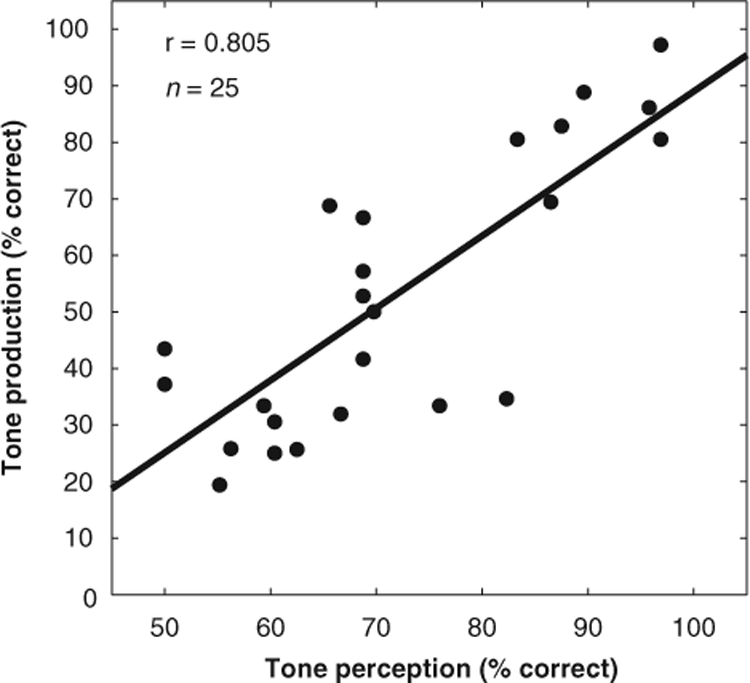
Correlation between tone perception and tone production performance in the 25 prelingually deafened children with cochlear implants. Each symbol represents one of the subjects and the solid line represents the least-squares fit of the data.