
Figure 2.
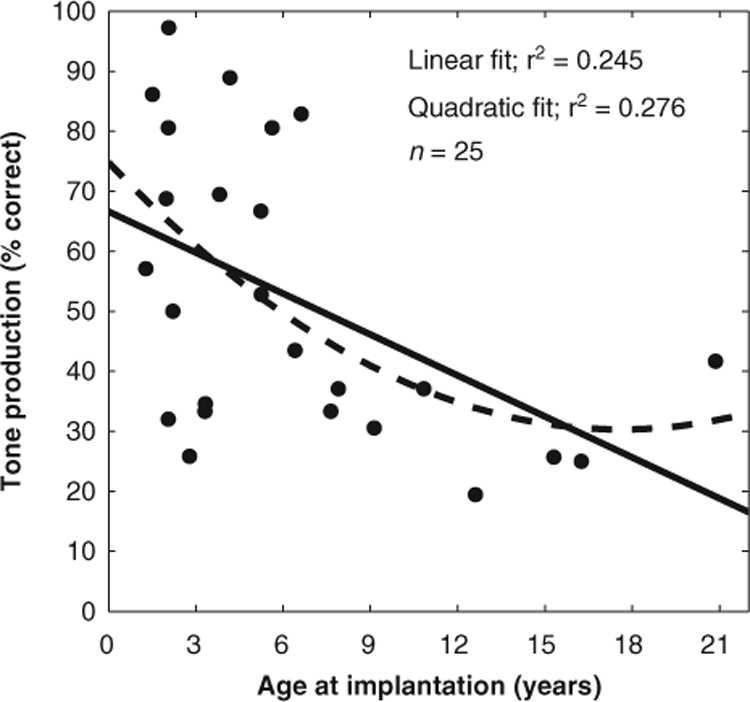
Scatter plot oftone production performance versus age at implantation. Each symbol represents one of the subjects. The solid line and the dashed line represent the linear and quadratic fit of the data, respectively.
Official websites use .gov
A
.gov website belongs to an official
government organization in the United States.
Secure .gov websites use HTTPS
A lock (
) or https:// means you've safely
connected to the .gov website. Share sensitive
information only on official, secure websites.
Scatter plot oftone production performance versus age at implantation. Each symbol represents one of the subjects. The solid line and the dashed line represent the linear and quadratic fit of the data, respectively.