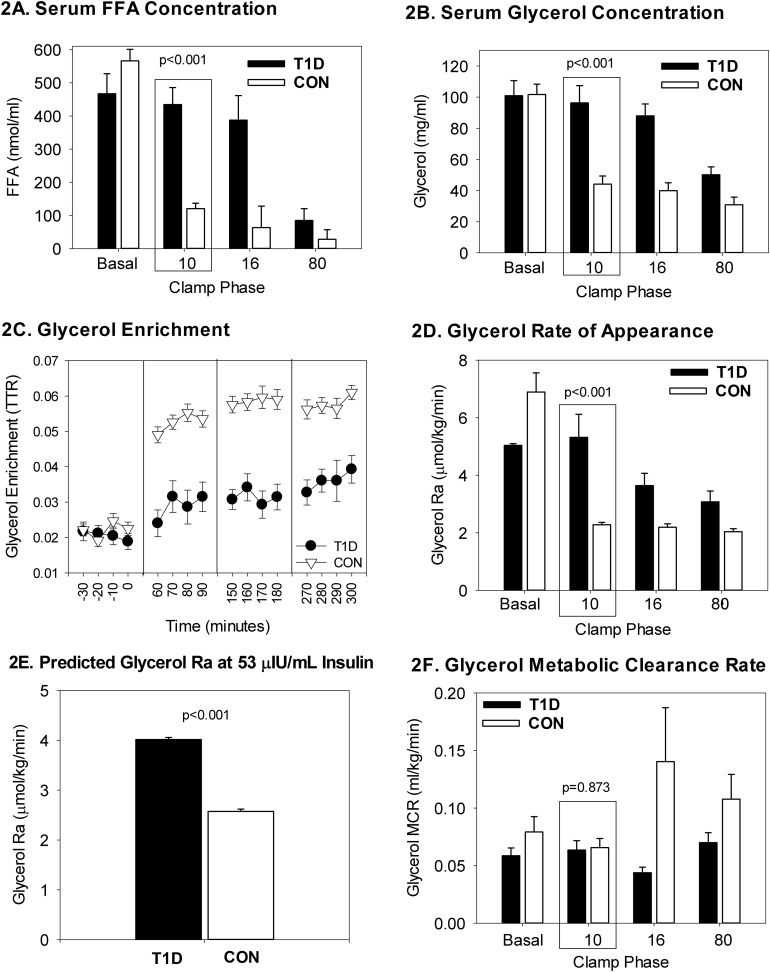
Figure 2.
Lipid-related measurements from the four-phase hyperinsulinemic clamp. Data are shown according to T1D and non-T1D status and by phase of the clamp, denoted per insulin dose as nonrepeated measures. Primary lipid endpoints of serum FFA and glycerol concentrations and adipose IR were quantified during the 10-mU/m2/min phase. The remaining phase values were used for modeling the entire curves per group. Data are presented as mean and SEM. (A) Serum FFA were higher in T1D during the adipose phase 10 of the clamp. (B) Serum glycerol were higher in T1D during the adipose phase 10 of the clamp. (C) Glycerol enrichment was higher in controls after the basal phase in controls. (D) Glycerol rate of appearance was higher in T1D during phase 10 of the clamp. (E) Predicted glycerol Ra is higher in T1D at 53 μIU/mL insulin. (F) Glycerol clearance is similar between groups during the adipose phase 10 of the clamp. CON, control; TTR, tracer-to-tracee ratio.

