Figure 3.
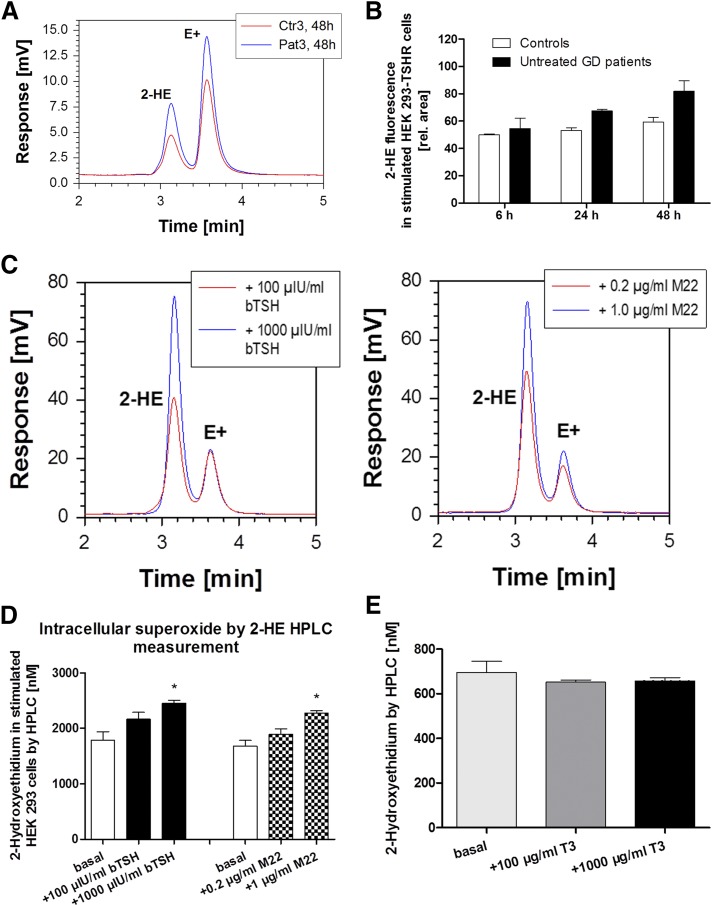
(A) Chromatograms of the fluorescence detection of the superoxide-specific 2-HE and unspecific E+ oxidation products of DHE. The peaks for 2-HE and E+ are examples for a patient with untreated GD (in red) vs a serum sample from a healthy control subject (Ctr) (in blue) after 48-hincubation in HEK-293 TSHR cells. (B) Measurement of superoxide-specific 2-HE by HPLC. The graph shows a time course of 6, 24, and 48 h after incubation of HEK-293 TSHR cells with human sera. Untreated hyperthyroid patients with GD (black bars, n = 8) and euthyroid healthy control subjects (white bars, n = 8) are shown with the corresponding 2-HE fluorescence signal. Levels of 2-HE in HEK-293 TSHR cells incubated with serum from patients with untreated hyperthyroid GD (after 48 h) were markedly different vs control subjects after 6, 24, and 48 h and vs the 6-h patient group (P < 0.05), respectively. (C) Chromatograms of the fluorescence detection of the superoxide-specific 2-HE and unspecific E+ oxidation products of DHE. The peaks for 2-HE and E+ are examples for HEK-293 TSHR cells upon stimulation with bovine TSH (100 vs 1000 µIU/mL) or with the M22 MAb (0.2 vs 1.0 µg/mL). (D) Measurement of superoxide-specific 2-HE by HPLC. The graph shows the effects of stimulation of HEK-293 TSHR cells with bovine TSH (100 and 1000 µIU/mL, black bars) or with M22 MAb (0.2 vs 1.0 µg/mL, checkered bars) on intracellular superoxide formation as measured by HPLC-based quantification of 2-HE (n = 4 independent experiments). Basal levels are also shown (incubation of cells without bovine TSH and M22 MAb, white bars). The highest concentrations of both stimulators caused a significant increase in superoxide formation. *P = 0.0028 and P = 0.0082, respectively. (E) Intracellular superoxide by 2-HE HPLC measurement. The graph shows the effects of stimulation of HEK-293 TSHR cells with T3 (100 µg/mL, dark gray bar) and 1000 µg/mL (black bar) on intracellular superoxide formation as measured by HPLC-based quantification of 2-HE (n = 4 independent experiments). Basal levels are also shown (incubation of cells without T3, light gray bar).

