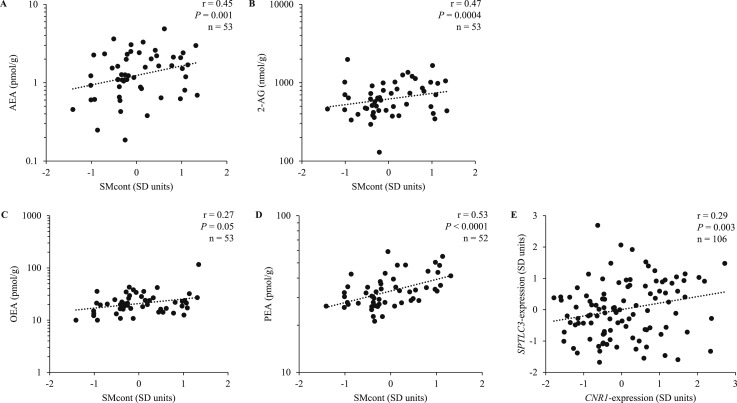
Figure 1.
Relationships between (A) AEA, (B) 2-AG, (C) OEA, and (D) PEA and the overall sphingomyelin content in skeletal muscle (SMcont), calculated as the average of individual sphingomyelin z scores reported in Table 2. For PEA, n = 52 because one subject had highly leveraged values for these measures (association between SMcont and PEA r = 0.54, P < 0.0001 upon inclusion). (E) The positive relationship between SPTLC3 and CNR1 gene expression levels in skeletal muscle. Gene expression levels were batch- and sex-standardized and reported in SD units. Pearson partial correlations are reported.

