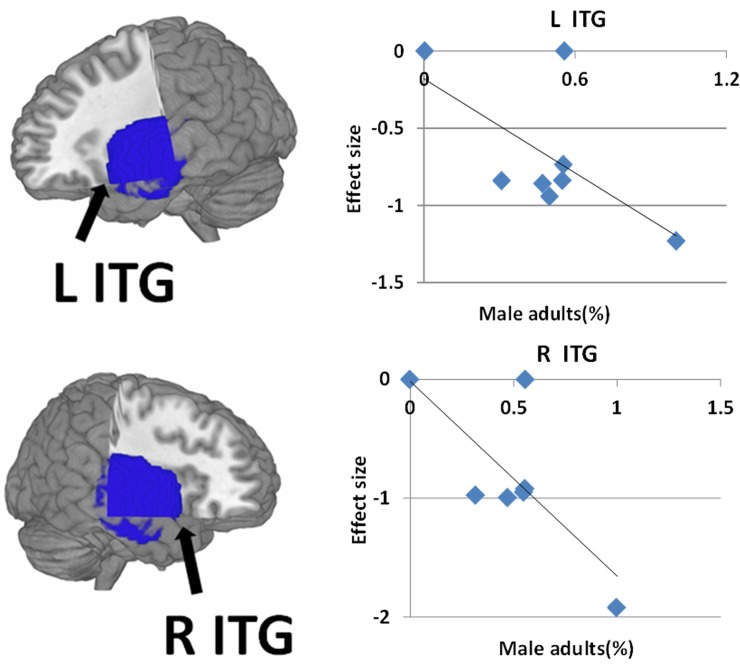
Fig 4. Meta-regression results show that the percentage of male patients was negatively correlated with gray matter in the bilateral temporal lobe.
In the graphs, the effect sizes needed to create this plot have been extracted from the peak of maximum slope significance, and each study is represented as a dot. The regression line (meta-regression signed differential mapping slope) is shown. Abbreviation: ITG, inferior temporal gyrus; L, left; R, right.

