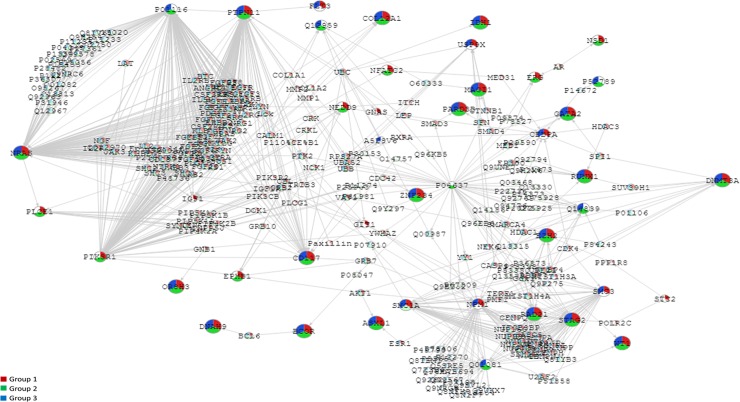
Fig 5. Network-based analysis (SNOW; Babelomics) applied to 28 selected genes.
The network was complemented with the co-occurrence relationships, in order to summarize the two kind of significant results. Significant network-based analysis genes are coloured depending their categorical group: patients with NK and/or well- known gene mutations (Group 1, red), patients with NK and without mutations in NPM1, CEBPA and FLT3–ITD (Group 2, green) and IR patients with cytogenetic abnormalities and/or known molecular features (Group 3, blue). Grey edges represent protein-protein interaction, relationships, broad orange dashed lines describe significant co-occurrences.

