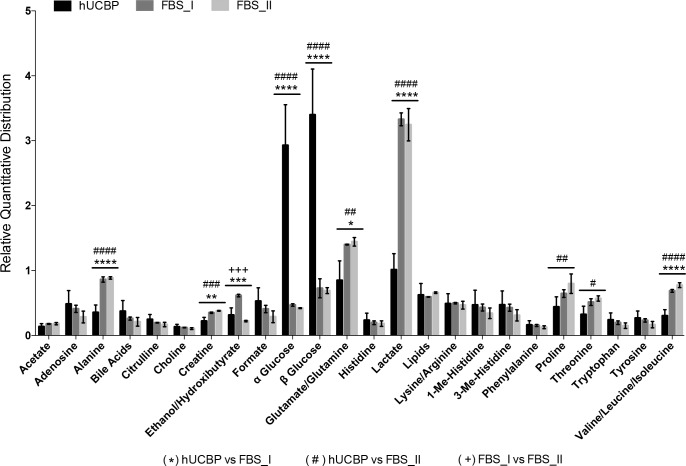
Fig 2. Relative quantitative distribution of the metabolites in hUCBP, FBS_I and FBS_II.
Results presented as Mean ± SEM. Symbols reflect differences between hUCBP and FBS_I (*), hUCBP and FBS_II (#), and FBS_I and FBS_II (+), where the numbers of symbols represents the P value (1 symbol: 0.01≤P≤0.05; 2 symbols: 0.001≤P<0.01; 3 symbols: 0.0001≤P<0.001; 4 symbols: P<0.0001).

