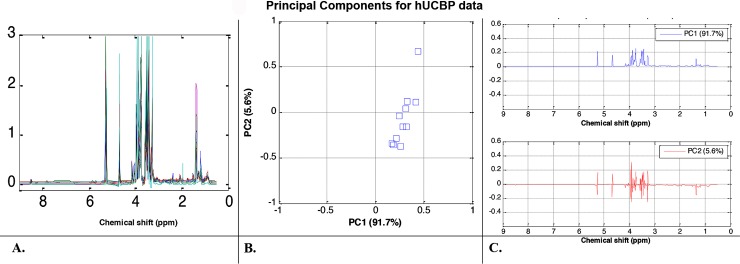
Fig 3. Metabolomic analysis of hUCBP samples.
(A) 1H-NMR spectral trajectories of the hUCBP samples; (B) 2D (PC1 vs. PC2) PCA score plot shows that hUCBP data are well clustered (i.e. there is high similarity between the donor samples) with exception of one donor (considered as an outlier) and (C) corresponding loadings plots illustrate that sugars and lactate content are the main metabolites responsible for the divergence between the hUCBP samples.

