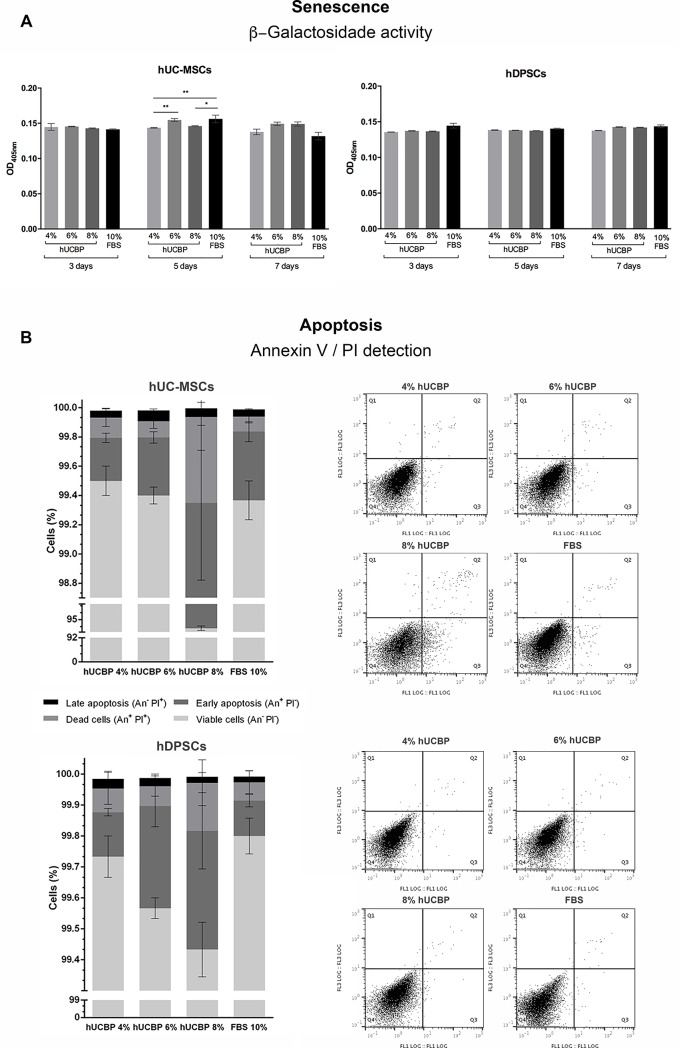
Fig 8.
Senescence and Apoptosis: A) Senescence - β-Galactosidase activity (OD405nm) on UC-MSCs and DPSCs at 3, 5 and 7 days. Results Presented as Mean ± SEM. Significance of the results is indicated according to P values with one, two, three or four of the symbols (*) corresponding to 0.01≤P<0.05; 0.001≤P< 0.01; 0.0001≤P<0.001 and P<0.0001, respectively; B) Apoptosis: Annexin-V/ PI detection of UC-MSCs (upper panel) and DPSCs (lower panel). Results Presented as Mean ± SEM. Dot Plots of the correspondent data are presented at the right side of the panels. Top left quadrants match annexin V negative and PI positive cells; Top right quadrants correspond to dead cells that express annexin V and PI positive; Bottom right quadrants pairs with apoptotic cells that express annexin V positive and PI negative; and for last, bottom left quadrants, viable cells that express neither annexin V or PI.

